What is MACD Indicator?
- ▶<span lang="EN-US" dir="ltr"><strong>How does the MACD Indicator Work?</strong></span><strong> </strong>
- ▶<span lang="EN-US" dir="ltr"><strong>Components of MACD</strong></span><strong> </strong>
- ▶<span lang="EN-US" dir="ltr"><strong>What Does MACD Show? </strong></span><strong> </strong>
- ▶<span lang="EN-US" dir="ltr"><strong>Key MACD Signals & their Meaning </strong></span><strong> </strong>
- ▶<span lang="EN-US" dir="ltr"><strong>How Traders Use MACD for Trading </strong></span><strong> </strong>
- ▶<span lang="EN-US" dir="ltr"><strong>Conclusion </strong></span><strong> </strong>
The MACD (Moving Average Convergence Diverence) serves as a technical analysis tool to track price momentum shifts and trends. It compares two exponential moving averages of a security's price to spot trend changes. Traders use the MACD indicator to find buy or sell signals and measure price strength. By watching MACD line movements and crossovers, traders spot entry and exit points. This article covers what is MACD indicator, how it works, its components, and how it is useful for traders.
Note: Refer this Image as we need to create image like this.
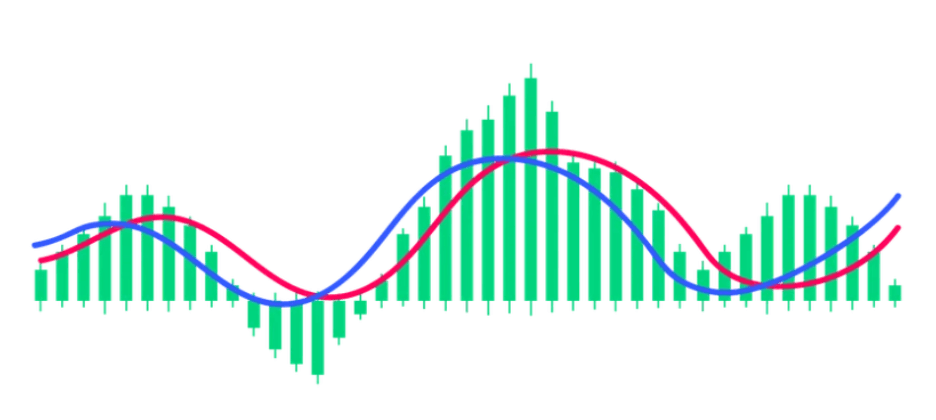
How does the MACD Indicator Work?
MACD in stock market works in the following way.
- The MACD indicator tracks momentum through two Exponential Moving Averages (EMAs) of stock price.
- It pairs a 12-period short EMA with a 26-period long EMA.
- Their difference creates the MACD line to show momentum shifts.
- A 9-period EMA of the MACD line acts as the signal line for trade signals.
- MACD above signal suggests bullish momentum buildup.
- MACD below signal points to fading momentum or downtrends.
Example:
A stock MACD crossing above signal on charts signals potential buys. MACD dropping below signal warns of sells as momentum slows.
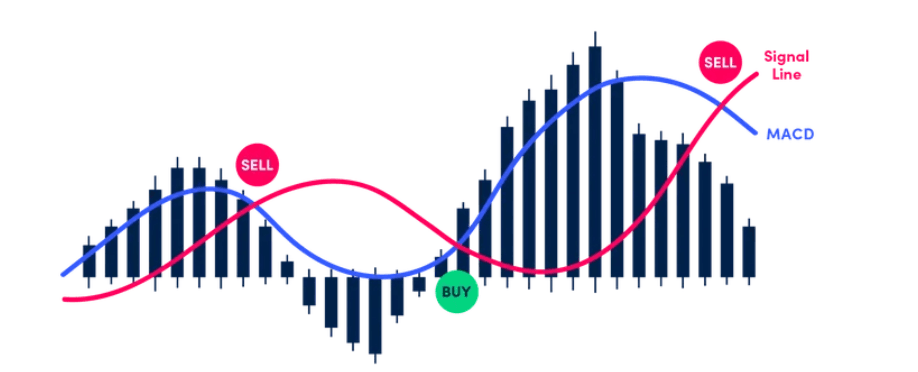
Components of MACD
The components of the MACD team are:
- MACD Line
This line equals 12-period EMA minus 26-period EMA. It shifts fast with prices to flag momentum changes. - Signal Line
A 9-period EMA of the MACD line. It lags slightly to confirm crossovers for trades. - MACD Histogram
Bars show MACD minus signal line gap. Bars above zero mark growing momentum; below show weakness.
Note: Refer this Image as we need to create image like this.
What Does MACD Show?
Understanding MACD meaning helps traders understand valuable insights about market behaviour and potential trading opportunities.
- Trend Strength: This indicator helps one determine whether the trend has been strong, whether the market has been trending upwards, downward, or sideways.
- Trend Direction: The indicator generates signals when the MACD line crosses above or below the signal line. The crossover above the signal line indicates a bullish market, while a crossover point below indicates a bear market.
- Momentum Shifts: MACD helps identify how quickly and strongly prices move. Rising bars of the histogram indicate strengthening momentum whereas decreasing bars indicate weakening momentum.
Key MACD Signals & their Meaning
Here are a few vital signals given by the MACD that could be beneficial for traders in knowing the market movements.
- Signal Line Crossover
This happens when the MACD line intersects with the signal line. An upward intersection may represent a buying opportunity, while a downward intersection may be viewed as a sell signal.
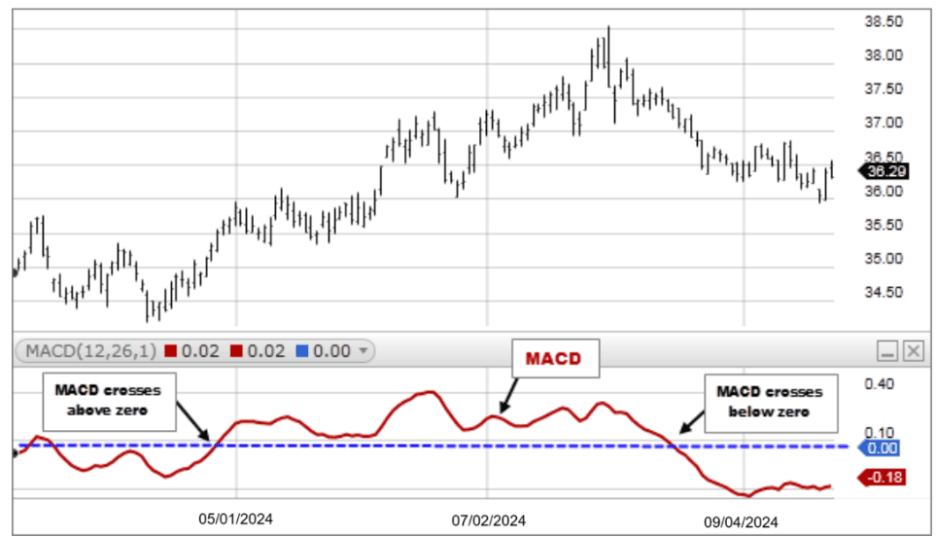
- Zero-Line Crossover
When the MACD line intersects the zero level, momentum changes. When it goes above the zero level, it indicates there is positive momentum; on the other hand, if it goes below the zero level, there’s negative momentum.
- Divergence
Divergence occurs when MACD and price move in opposite directions. This may suggest weakening momentum. Divergences are often observed near trend turning points, but they can be less reliable in fast-moving markets.
Note: Refer this Image as we need to create image like this.
How Traders Use MACD for Trading
Traders typically apply the MACD indicator in various practical ways to enhance their trading decisions and strategies.
- Entry Timing: Traders can also take the crossovers to enter a trade when the momentum starts to turn around.
- Exit Confirmation: Traders can use the MACD when identifying whether momentum is losing strength.
- Momentum Validation: Primarily applied to confirm the validity of a price move with the momentum.
Disclaimer: All investments are subject to market risks, economic conditions, regulatory changes, and other external factors. Returns are not guaranteed and may vary based on market performance and investment tenure. Investors should assess their risk tolerance and financial objectives, conduct their own research, and consult a qualified financial advisor before making any investment decisions.
Conclusion
MACD is commonly employed for the analysis of market movement, changes in market momentum, as well as trading signals. It does not predict results, however, it may provide insights to traders for understanding price behaviour more clearly. When used with other indicators and price analysis, MACD can offer an additional perspective. Many traders observe MACD signals through a stock market trading app to monitor charts and trends more conveniently before making decisions.
- BlinkX launches ItsATraderThing Campaign
- blinkX Introduces 'Options Watchlist' to Empower Traders with Real-Time Insights
- BlinkX Enhances Trading with 24/7 Customer Support Capabilities
- Unlocking Seamless Trading: Introducing “Order Slicing” For The FnO Market
- A Game-Changer for Traders: Introducing Horizontal Watchlists
FAQs on What is MACD Indicator
What is MACD full form in Stock Market?
MACD in stock market stands for Moving Average Convergence Divergence.
Is MACD a leading or lagging indicator?
MACD is generally considered a lagging indicator because it is based on historical price data through moving averages.
What are limitations of MACD indicator?
It may give delayed signals and can produce false indications in sideways markets.
Is the MACD a reliable indicator?
MACD can be useful in trending markets, especially when combined with other technical tools. However, it does not guarantee accuracy and is generally used as a supporting indicator rather than a standalone signal.
Is MACD used by professional traders?
Yes. Many professional traders use MACD as part of their technical analysis toolkit. They often combine it with other indicators, chart patterns, and fundamental analysis to make comprehensive trading decisions.