What is Hanging Man Candlestick Pattern: Meaning, Uses, Differences & Example
- ▶<span lang="EN-US" dir="ltr"><strong>How the Hanging Man Candlestick Pattern Forms</strong></span>
- ▶<span lang="EN-US" dir="ltr"><strong>What Does the Hanging Man Pattern Indicate?</strong></span>
- ▶<span lang="EN-US" dir="ltr"><strong>Characteristics of the Hanging Man Candlestick Pattern</strong></span>
- ▶<span lang="EN-US" dir="ltr"><strong>Example of Hanging Man Candlestick Pattern</strong></span>
- ▶<span lang="EN-US" dir="ltr"><strong>How to Trade Using the Hanging Man Candlestick Pattern?</strong></span>
- ▶<span lang="EN-US" dir="ltr"><strong>Difference Between Hanging Man, Shooting Stars, and Hammers</strong></span>
- ▶<span lang="EN-US" dir="ltr"><strong>Advantages and Disadvantages of Hanging Man Candlestick Pattern</strong></span>
- ▶<span lang="EN-US" dir="ltr"><strong>Conclusion</strong></span>
The Hanging Man candlestick pattern is a bearish reversal pattern that appears after a strong upward trend. It suggests that buying momentum may be weakening and sellers could start gaining control. As more traders use technical analysis and trading apps today, understanding candlestick patterns has become important for making informed trading decisions. This article explains how the Hanging Man pattern forms, what it indicates, and how traders use it.
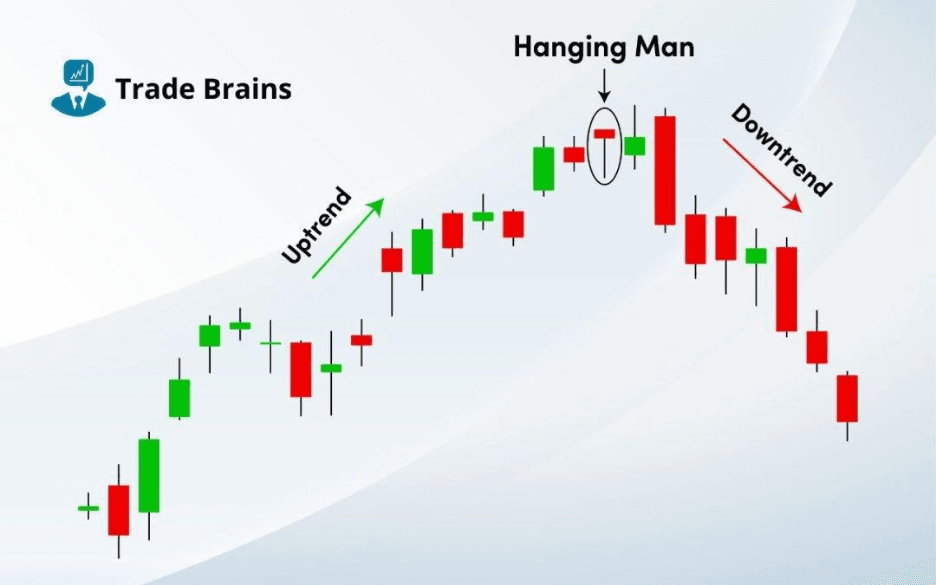
Refer Image – BlinkX Teams needs to add similar kind off image
How the Hanging Man Candlestick Pattern Forms
Here’s how the pattern develops:
- Appears After a Strong Upward Trend
The pattern forms when prices have been rising steadily, showing strong buyer control. The appearance of a Hanging Man suggests that this upward strength may slow down. - Small Real Body Located Close to the Top of the Candle
The small real body indicates that the opening and closing prices are very close to each other. This indicates that the buyers were not able to sustain strong control throughout the trading session. - Long Lower Shadow
The long lower shadow indicates that the sellers were able to drive the prices down significantly during the trading session. Although the buyers were able to drive the prices yet the selling pressure is still important. - Little or No Upper Shadow
This indicates that prices did not move much higher than the opening or closing price. It may signal weakening buying strength. - Market Psychology Behind the Formation
In simple terms, the pattern shows that sellers are entering the market. Many times, this creates hesitation among buyers and may lead to a bearish reversal if confirmed by the next candle.
What Does the Hanging Man Pattern Indicate?
The hanging man pattern candlestick indicates:
- Buyers are losing control after a strong uptrend.
- Sellers are beginning to push prices lower during trading sessions.
- Market sentiment may shift from bullish to bearish.
- The current uptrend may slow down or reverse.
- Confirmation from the next bearish candle increases reliability.
Overall, the pattern helps traders adjust entry and exit strategies and manage risk more effectively. It works in different market situations and is used by many traders across the industry.
Characteristics of the Hanging Man Candlestick Pattern
The following factors matter because they improve interpretation accuracy and help traders understand the pattern more clearly.
Body:
The candle has a small real body that is located close to the top of the price range. The small real body indicates that the opening and closing prices are close to each other. This indicates that the buyers did not have strong control over the market during the trading session.
Lower Wick:
The lower wick is long and, in most cases, at least twice as long as the real body. This indicates that the sellers had strong control over the market during the trading session and pushed the prices down. Although the prices may have recovered later, the strong downward movement indicates strong selling pressure in the market.
Upper Wick:
The upper wick is normally very small or absent. This indicates that the prices did not move much higher during the trading session. This may indicate a weakening in the buying strength in the market.
Structure:
The candle has a small real body, a long lower shadow, and little or no upper shadow. The combination of these factors indicates a visual signal that may indicate a possible change in market strength.
Significance:
The pattern highlights potential selling pressure. Traders usually wait for confirmation because one candle alone does not guarantee a reversal. Confirmation helps improve reliability and reduces false signals.
Colour:
The candle can be bullish or bearish. However, a bearish Hanging Man is often considered stronger because it reflects higher selling pressure. Colour should not be used alone when making trading decisions.
Example of Hanging Man Candlestick Pattern
To further understand the example of hanging man candlestick pattern in stock market, below is an example
Stock XYZ
Open price: Rs.50
High: Rs.52
Low: Rs 49
Close: Rs 50.10
As observed in the stock chart for the following securities, here the small and located at the upper end of the overall price range of the day.
The upper shadow is long, usually considered at least twice the size of the real body. And the lower shadow which is the difference between the real body’s bottom and the low which is very short.
To visualise the Hanging Man candlestick refer this diagram:
High
/\
/ \
Open --> / \ <-- Close
/ \
Low --------> --------> --------> --------> -------→
From the reference, the hanging man candlestick pattern has a small real body, which indicates the difference between the open and close prices. And the pattern position near the high of the day.
In the following example, one can identify that the bullish trend is weakening and the bear's trend might take the control which shows a potential reversal. Individuals can also consider other technical indicators before making any trading decisions in the stock market.
How to Trade Using the Hanging Man Candlestick Pattern?
The Hanging Man pattern is a bearish reversal pattern and hence is a potential signal for traders to consider exiting long positions or building short trades. However, before making trading decisions, it is essential to exercise caution and rely on confirmation from other technical indicators. That is because no technical pattern is foolproof. Moving on, while trading the Hanging Man pattern, keep the following points in mind:
Since candlestick patterns are not foolproof, traders may wait for confirmation in the form of a bearish candlestick or a lower close in the following sessions. Consider not selling all your positions or deploying all your capital to short an asset just because you see a Hanging Man candlestick. You could also combine it with other indicators to increase its reliability.
For example, trading volume analysis might provide extra information. Higher volume during the creation of the Hanging Man signifies higher significance and reinforces the possibility of a trend reversal. That is because high value indicates high trading activity in this case, a strong presence of active selling pressure.
Likewise, even look out for support and resistance levels. A hanging Man pattern occurs near a strong resistance level, it strengthens the bearish signal. Conversely, if it forms near a strong support level, the significance of the pattern may diminish, and additional confirmation becomes crucial.
Difference Between Hanging Man, Shooting Stars, and Hammers
The Hanging Man candlestick pattern is often confused with the Shooting Star and Hammer patterns. While these patterns share some similarities, they have distinct characteristics that traders must be aware of:
Shooting Star: The Shooting Star is also a bearish reversal pattern, and similar to the Hanging Man, the shooting star appears during an uptrend and requires confirmation for a valid signal. However, it is characterised by a small body near the low end of the trading range and a long upper wick, as opposed to a small body at the top and long lower wick of the Hanging Man.
Hammer: On the other hand, the Hammer resembles the Hanging Man, as it has a small body near the high end of the trading range and a long lower wick. However, the key difference between is that—the hammer is a bullish reversal pattern that emerges at the end of a downtrend. The hammer indicates a potential bullish trend reversal to the upside and requires confirmation for a valid signal. It suggests that buyers are stepping in and can be an opportunity for long trades.
It is important for traders to understand the distinctions between these patterns to avoid misinterpreting signals and making incorrect trading decisions. While the Hanging Man, shooting star, and hammer share similarities in terms of their body size and long wicks, their positions within the trend and the subsequent confirmation required differ significantly.
Advantages and Disadvantages of Hanging Man Candlestick Pattern
Advantages of Hanging Man Candlestick Pattern | Disadvantages of Hanging Man Candlestick Pattern |
| Helps identify possible trend reversals | Does not guarantee price reversal |
| Easy to recognise and use | Requires confirmation from other indicators |
| Useful across different market conditions | May produce false signals in volatile markets |
| Works well with other technical tools | Reliability depends on overall trend strength |
| Helps traders manage entry and exit strategies | Needs experience to interpret correctly |
Conclusion
The Hanging Man candlestick pattern is an important bearish reversal signal that forms after an uptrend and reflects weakening buying momentum. It develops with a small real body and a long lower shadow, showing growing selling pressure. In short, the pattern helps traders spot potential market turning points. Today, as trading shifts towards digital platforms and new tools powered by latest tech continue to grow, analysing candlestick patterns has become easier and more accessible. Many traders rely on data available through a stock market trading app to track price movements and evaluate signals smoothly. Overall, the Hanging Man pattern remains a useful and reliable indicator for traders across different experience levels.
- BlinkX launches ItsATraderThing Campaign
- blinkX Introduces 'Options Watchlist' to Empower Traders with Real-Time Insights
- BlinkX Enhances Trading with 24/7 Customer Support Capabilities
- Unlocking Seamless Trading: Introducing “Order Slicing” For The FnO Market
- A Game-Changer for Traders: Introducing Horizontal Watchlists
Hanging Man Candlestick Pattern FAQs
What is an indication of a hanging man pattern candlestick?
The hanging man pattern is a candlestick is a potential reversal trend indicator. As it forms during the uptrend and indicates the possible reversal.
Is the hanging man different from the other candlestick pattern?
Yes, the hanging man candlestick pattern is different from other patterns as the small body is positioned near the hgh of the day and its long upper shadow in the high of the day. Unlike hammer pattern which is similar in appearance but takes place during a downtrend, which indicates a bullish pattern.
Can you use the hanging man candlestick with other patterns?
Yes, you can use other patterns or combinations of patterns to get an appropriate result.
How to find the hanging man pattern?
To identify a hanging man candlestick pattern, you need to look for a small real body near the high of the day, and a long upper shadow as twice as the length of real body, and a very short existent lower shadow.
Can the Hanging Man pattern occur during a downtrend?
No, since the Hanging Man is a bearish reversal pattern, it must emerge at the end of an uptrend.