What is a Supertrend Indicator?
- ▶<span lang="EN-US" dir="ltr"><strong>How Does Super Trend Indicator Work?</strong></span><strong> </strong>
- ▶<span lang="EN-US" dir="ltr"><strong>Importance of the Super Trend Technical Indicator</strong></span><strong> </strong>
- ▶<span lang="EN-US" dir="ltr"><strong>Advantages & Disadvantages of Using Supertrend Technical Indicator</strong></span><strong> </strong>
- ▶<span lang="EN-US" dir="ltr"><strong>Conclusion</strong></span><strong> </strong>
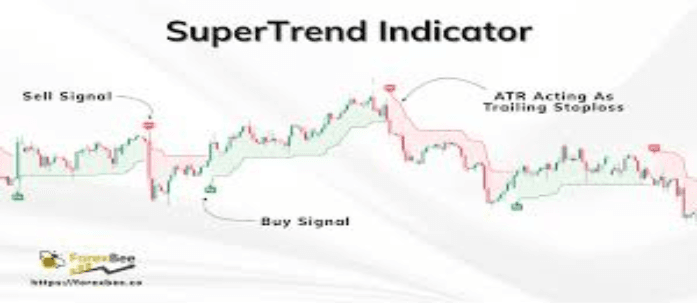
Supertrend indicators refer to a technical analysis tool. It helps traders in identifying the current direction of market trend and also provides possible buy or sell signals. This indicator is presented as a line on the price chart that moves upwards and downwards depending on the price movements. If the supertrend line appears below the price, then it indicates an upward or bullish trend. However, if the line is above the price then it suggests a downward or bearish trend. This is used by traders to identify the entry and exit points. This article explains what is supertrend indicator, how it works, its advantages, disadvantages, and more.
Note: Refer this Image as we need to create image like this.
How Does Super Trend Indicator Work?
- Here’s a simple process of how the supertrend indicator works:
- The supertrend indicator is based on two key elements, which are referred to as: Average True Range (ATR) and a multiplier. These elements help to measure market uncertainty.
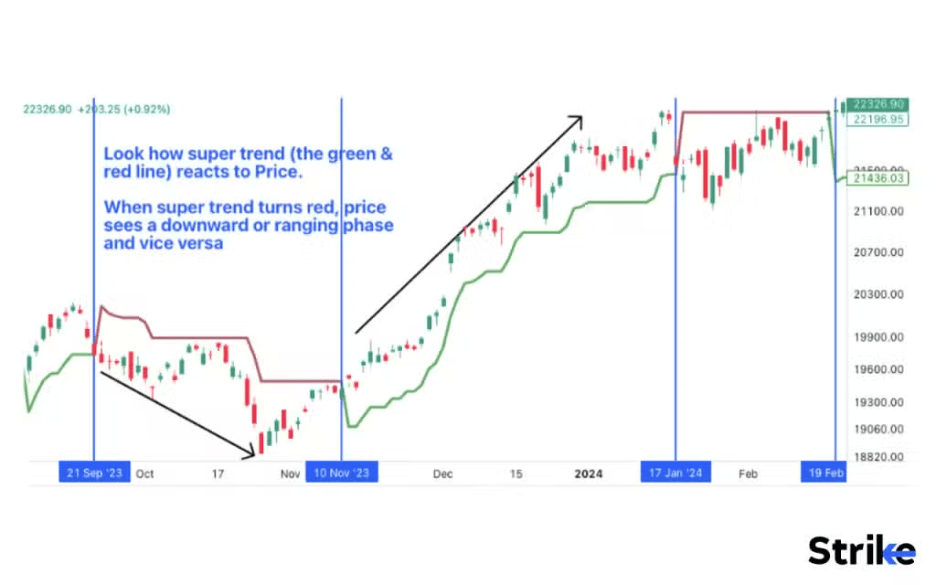
- If the supertrend line appears below the price, then it indicates a bullish trend, this suggests that the prices may continue to move upward.
- If the Supertrend line appears above the price, it signals a bearish trend. This usually indicates that the price may move downward.
- Traders often use this indicator to follow the trend and identify potential entry and exit points in the market.
- A buy signal usually takes place when the Supertrend line shifts from above the price to below it.
- A sell signal appears when the line moves from below the price to above it, which may indicate a possible trend reversal.
- Many traders combine the Supertrend indicator with other indicators such as moving averages or RSI to confirm trading signals.
Example: Suppose a stock is trading at ₹500 and the Supertrend line is present at ₹485, which is below the price. Then this situation indicates that the market is currently in an upward trend. However, if the stock price continues to rise to ₹520 and the Supertrend line also moves upward while remaining below the price, then traders may continue holding their positions. However, if the price falls to ₹480 and the Supertrend line shifts above the price, it may signal a possible sell opportunity because the trend may be turning bearish.
Note: Refer this Image as we need to create image like this.
Calculation of a Super Trend Indicator
The calculation of Supertrend indicator is simple, it is calculated using the Average True Range (ATR) and a multiplier value. The supertrend indicator formula is:
TR = \max[(High - Low), |High - Previous\ Close|, |Low - Previous\ Close|]
Once the True Range values are calculated for each period, the Average True Range (ATR) is determined by averaging the TR values over a specific time frame, commonly 14 periods. The ATR formula is:
ATR = \frac{[(Prior\ ATR \times 13) + Current\ TR]}{14}
Here are the simple steps involved in the calculation:
- Calculate the Average True Range (ATR): First the average true range needs to be calculated. It measures the volatility of a stock over a specific period, commonly 10 or 14 periods.
- Find the basic price average: Then the average of the high and low price of a period is calculated.
- Multiply ATR by the multiplier: A common multiplier is used by traders which is generally 3.
- Determine the bands:
- Upper Band = (High + Low) / 2 + (Multiplier × ATR)
- Lower Band = (High + Low) / 2 − (Multiplier × ATR)
- Plot the Supertrend line: The indicator switches between the upper and lower bands depending on the price movement.
Example Calculation: Suppose these are the following values for a stock:
High Price = ₹520
Low Price = ₹500
ATR = 10
Multiplier = 3
Step 1: First, we need to calculate the average price (520 + 500) / 2 = 510
Step 2: Multiply ATR by multiplier, 3 × 10 = 30
Step 3: Calculate bands
- Upper Band = 510 + 30 = 540
- Lower Band = 510 − 30 = 480
If the stock price stays above ₹480, the Supertrend may remain in a bullish trend. If the price drops below this level, the indicator may switch and signal a bearish trend.
Importance of the Super Trend Technical Indicator
The primary reason why the super trend technical indicator is useful is as follows:
Detecting patterns: The super trend indicator aids traders in determining a trend's direction on the financial markets, and this is crucial since it can influence their decision to purchase, sell, or hold an asset.
Volatility of Asset: The average true range (ATR) is used by the super trend technical Indicator to account for the volatility of the traded asset. As a result, even in extremely turbulent markets, the powerful Trend Indicator may assist traders in spotting patterns.
Signal Generation: The super trend trading Indicator can produce buy and sell signals based on changes in the trend's direction. As a result, traders may be better able to decide whether to enter or abandon a deal.
Simple to Use: Traders of all skill levels appreciate the super trend indicator because it is simple to use and can be applied to a wide range of assets and timeframes.
Advantages & Disadvantages of Using Supertrend Technical Indicator
The table below shows the advantages and disadvantages of using the supertrend technical indicator:
Advantages of Using Supertrend Technical Indicator | Disadvantages of Using Supertrend Technical Indicator |
The Supertrend indicator is simple to understand and easy for beginners to use. | The indicator may generate false signals in sideways or range-bound markets. |
It helps traders clearly identify the current market trend by showing whether the trend is bullish or bearish. | It is a lagging indicator since it is founded on previous price history and volatility. |
The indicator also gives the buy and sell signals, which may assist the traders to plot the entrances and the exits. | During highly volatile market conditions, the indicator may change direction frequently, causing confusion. |
It works well in strong trending markets, helping traders follow the market direction. | Relying only on the Supertrend indicator may increase trading risk without confirmation from other indicators. |
The indicator can be used in multiple timeframes, including intraday, swing trading, and positional trading. | The success of the indicator lies on the ATR period and multiplier settings, which might require modification to different markets. |
It is easy to integrate with any other technical indicator like moving averages, RSI, or MACD thus enhancing the trading decisions. | The indicator can respond slowly to price changes in low or slow moving markets. |
Conclusion
Traders use the super trend indicator, a technical analysis tool, to determine the trend's direction in the financial markets. Plotted as a line above or below the price chart, it is determined using an average true range (ATR) of the asset that has been traded. For spotting trends, correcting for volatility, and producing buy and sell signals, the super trend indicator is crucial. The fact that it is a lagging indicator, produces incorrect signals, & should be used in combination with other tools are some of its drawbacks. The Super Trend Technical Indicator should be used as part of a thorough trading strategy after traders weigh its benefits and drawbacks. In this following article traders can evaluate different ratios and try this indicator in the stock market, they can easily apply to these indicators and monitor price charts through a reliable online trading app.
- BlinkX launches ItsATraderThing Campaign
- blinkX Introduces 'Options Watchlist' to Empower Traders with Real-Time Insights
- BlinkX Enhances Trading with 24/7 Customer Support Capabilities
- Unlocking Seamless Trading: Introducing “Order Slicing” For The FnO Market
- A Game-Changer for Traders: Introducing Horizontal Watchlists
FAQs on Super Trend Indicator
What is a super trend indicator?
A technical analysis tool called a super trend indicator is used by traders to determine the trend's direction in the financial markets. It is shown graphically as a straight line either above or below the price in the chart, with the color of the line depending on which way the trend is moving.
How does the super trend indicator work?
The super trend indicator computes a value for the traded asset based on its average true range (ATR), which is subsequently added to or deducted from the closing price of the asset depending on the trend. A line is drawn either side of the price chart to represent the value that results.
What is the purpose of the super trend indicator?
The super trend indicator is designed to assist traders in determining a trend's direction on the financial markets, adjusting for the extreme volatility of the stock being traded, and producing buy or sell signals based on shifts in the trend's direction.
How is the super trend indicator used by traders?
Traders can limit their risk by establishing stop-loss orders depending on the Super Trend line and using the super trend indicator to spot patterns in the financial markets and decide when to enter or exit a transaction.
How is a supertrend indicator calculated?
Supertrend indicator is a calculation that involves Average True Range (ATR) and a multiplier. The ATR is calculated and averaged on the True Range (TR), normally based on 10 or 14 periods. The mean of the low and high price is then computed and modified with the ATR and the multiplier to generate an upper and a lower band that constitute the Supertrend line.