What is a Tweezer Top Candlestick Pattern? Meaning, Formation & Trading Strategy
- ▶<span lang="EN-US" dir="ltr"><strong>Key Components and Characteristics</strong></span>
- ▶<span lang="EN-US" dir="ltr"><strong>How Does a Tweezer Top Pattern Form?</strong></span>
- ▶<span lang="EN-US" dir="ltr"><strong>What Does a Tweezer Top Indicate?</strong></span>
- ▶<span lang="EN-US" dir="ltr"><strong>Tweezer Top vs Tweezer Bottom</strong></span>
- ▶<span lang="EN-US" dir="ltr"><strong>How to Trade the Tweezer Top Pattern?</strong></span>
- ▶<span lang="EN-US" dir="ltr"><strong>Volume Confirmation in Tweezer Top Pattern</strong></span>
- ▶<span lang="EN-US" dir="ltr"><strong>Advantages and Disadvantages Tweezer Top Candlestick Patterns</strong></span>
- ▶<span lang="EN-US" dir="ltr"><strong>Conclusion</strong></span>
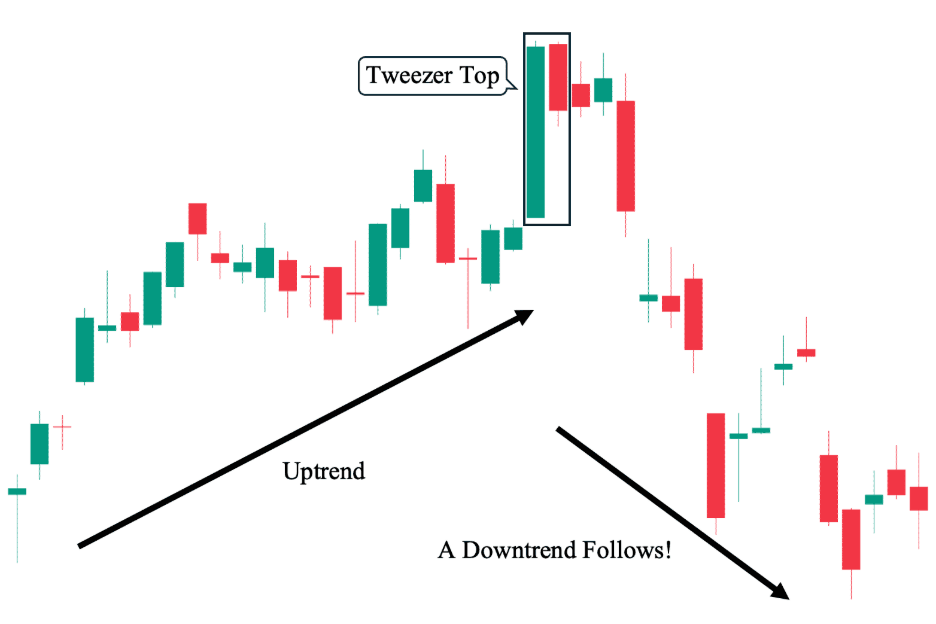
A tweezer top candlestick pattern is a technical chart formation that may appear after an upward price movement and is generally interpreted as a potential bearish reversal signal. It typically forms when two consecutive candles show similar highs, indicating resistance and weakening buying pressure. The pattern may reflect a shift in market sentiment from bullish to bearish conditions. This article explains the formation, interpretation, and trading approach related to tweezer top candlestick patterns for market analysis.
Refer Image – BlinkX Teams needs to add similar kind off image
Key Components and Characteristics
The tweezer top pattern has distinct identifying features.
- Context
It follows a consistent upward trend in which prices climb before encountering resistance. - Structure
The high points of two consecutive candlesticks are almost the same. - First Candle
The first candle is typically bullish, indicating strong buying interest and continuation of the upward trend. - Second Candle
The second candle, which shows selling pressure and a rejection of higher prices, is bearish. - Appearance
The matching highs of both candles create a resistance zone, signalling a possible reversal.
How Does a Tweezer Top Pattern Form?
The tweezer top pattern forms through specific price movements during an uptrend. The following are some conditions that must be met to successfully form a tweezer top pattern.
- Bullish Phase
A powerful bullish candle pushes prices higher from the beginning and closes close to its top. - Bearish Momentum
Although it is unable to sustain upward movement, the subsequent session begins close to the prior high. - Resistance Formation
The second candle’s high matches the first, creating a resistance level on the chart. - Shift Towards Selling Pressure
Usually closing lower, the second candle indicates weaker purchasing and possible downward momentum.
What Does a Tweezer Top Indicate?
The tweezer top pattern usually signals possible changes in market direction.
- Bearish Reversal Signal
The pattern may suggest that buying momentum is weakening and selling pressure is increasing, which can lead to a potential downward price movement. - Market Indecision
The tweezer top pattern shows a situation where buyers and sellers are equally strong at a particular price level. As a result, the price struggles to move clearly in one direction, reflecting uncertainty in the market and a possible change in trend. - Resistance Level Formation
Matching highs of consecutive candles often indicate a resistance level where prices face difficulty moving higher. - Change in Market Sentiment
The formation may signal a transition from bullish market behaviour to cautious or bearish sentiment.
Tweezer Top vs Tweezer Bottom
Understanding tweezer top candlestick patterns becomes clearer when compared with the opposite formation.
| Basis | Tweezer Top | Tweezer Bottom |
| Market Signal | Bearish reversal signal | Bullish reversal signal |
| Trend Context | Appears after an uptrend | Appears after a downtrend |
| Candle Structure | First bullish candle followed by a bearish candle | First bearish candle followed by a bullish candle |
| Price Level | Matching highs | Matching lows |
| Market Interpretation | Indicates resistance and selling pressure | Indicates support and buying interest |
How to Trade the Tweezer Top Pattern?
The pattern is typically traded using confirmation-based strategies.
- Confirm the Pattern
Traders generally look for additional indicators or a strong bearish candle following the pattern. - Identify Entry Point
A sell position may be considered after confirmation of downward price movement. - Place Stop-Loss
Stop-loss orders are often placed above the resistance level formed by the matching highs. - Set Target Levels
Target prices may be determined based on previous support levels or technical indicators.
Volume Confirmation in Tweezer Top Pattern
When examining a tweezer top pattern, volume confirmation is a crucial consideration. Increased trading volume when the second bearish candle forms makes the reversal signal more reliable. It adds weight to the possible downward movement by showing that more market players are actively selling. Low volume, on the other hand, can indicate less intense selling pressure, which would reduce the pattern's reliability. Before making a trade, traders frequently utilise volume in conjunction with other indicators to verify the reversal. Effective volume analysis can enhance market strategy decision-making and lessen false signals.
Advantages and Disadvantages Tweezer Top Candlestick Patterns
A tweezer top candle offers certain benefits and also has some limitations.
| Advantages | Disadvantages |
| May help identify potential reversal points in an uptrend. | The signal may produce false indications without confirmation. |
| Provides a clear visual structure that is relatively easy to recognise. | Effectiveness may vary across different market conditions. |
| Can be combined with technical indicators for better analysis. | Does not assure price reversal. |
| Helps identify resistance levels in price charts. | Requires additional confirmation from volume or indicators. |
Conclusion
The tweezer top pattern is a technical formation that may indicate a potential bearish reversal following an upswing. It appears when the highs of two successive candles match, indicating resistance and decreasing purchasing pressure. To make wise choices, traders employ risk management techniques, volume analysis, and confirmation signals. Recognising reversal moments and efficiently managing trades are made easier by knowing the structure and constraints of this pattern. To help make informed trading decisions, market participants frequently use a reliable stock market trading app to monitor such patterns.
- What is the Three Black Crows Pattern? Meaning, Formation & Trading Strategy
- What is a Harami Candlestick Pattern? Meaning, Types & Trading Strategy
- What is a Rising Wedge Pattern? Meaning, Formation & Trading Strategy
- All about Single Candlestick Patterns
- Pin Bar Candlestick Pattern? Meaning, Types & Trading Strategy
- BlinkX launches ItsATraderThing Campaign
- blinkX Introduces 'Options Watchlist' to Empower Traders with Real-Time Insights
- BlinkX Enhances Trading with 24/7 Customer Support Capabilities
- Unlocking Seamless Trading: Introducing “Order Slicing” For The FnO Market
- A Game-Changer for Traders: Introducing Horizontal Watchlists
FAQs on Tweezer Top Candlestick Pattern
What is a Tweezer Bottom?
A Tweezer Bottom is a bullish reversal pattern that forms after a downtrend, where two candles show matching lows, indicating support and potential upward movement.
How reliable are Tweezer patterns?
Tweezer patterns may provide useful signals, but their reliability typically improves when supported by volume or other technical indicators.
Which timeframe is best for Tweezer patterns?
The pattern may be observed across multiple timeframes, though longer timeframes are generally considered more reliable.
Can Tweezer patterns be used for intraday trading?
Yes, they may be used in intraday trading, but confirmation and risk management are typically required due to short-term volatility.
What is the difference between Tweezer Tops and Double Tops?
A Tweezer Top involves two consecutive candles with matching highs, whereas a Double Top forms over a longer period with two separate peaks at similar price levels.