What is a Harami Candlestick Pattern? Meaning, Types & Trading Strategy
- ▶<span lang="EN-US" dir="ltr"><strong>Characteristics of the Harami Pattern</strong></span>
- ▶<span lang="EN-US" dir="ltr"><strong>Types of Harami Candlestick Patterns</strong></span>
- ▶<span lang="EN-US" dir="ltr"><strong>What Does a Harami Pattern Indicate?</strong></span>
- ▶<span lang="EN-US" dir="ltr"><strong>Bullish Harami vs Bearish Harami</strong></span>
- ▶<span lang="EN-US" dir="ltr"><strong>How to Trade the Harami Candlestick Pattern?</strong></span>
- ▶<span lang="EN-US" dir="ltr"><strong>Volume Confirmation in Harami Pattern</strong></span>
- ▶<span lang="EN-US" dir="ltr"><strong>Advantages and Disadvantages Harami Candlestick Patterns</strong></span>
- ▶<span lang="EN-US" dir="ltr"><strong>Conclusion</strong></span>
The Harami pattern is a straightforward and effective candlestick in technical analysis. It involves two candles that frequently indicate a potential change in market direction. The term "Harami," derived from Japanese, translates to "pregnant," as the second candle appears contained within the first, similar to a foetus. It reflects a period of indecision between buyers and sellers, which may precede a reversal. Traders appreciate its clear visual structure and reliability with proper confirmation. In this article, characteristics of the Harami Pattern, its types, formation, and advantages are discussed.
Refer Image – BlinkX Teams needs to add similar kind off image
Characteristics of the Harami Pattern
The following characteristics help traders visually identify and validate a Harami candlestick pattern within an existing market trend.
- Established Prior Trend: It follows a well-defined prior trend: a downtrend for the bullish version and an uptrend for the bearish version.
- Large First Candle Body: The first candle features a large real body, demonstrating significant momentum from one side.
- Smaller Second Candle Within the First: The second candle has a notably smaller body, fully contained within the body of the first candle; its shadows may extend slightly beyond.
- Reversal Context: The pattern is most effective in reversal contexts, such as near support or resistance levels.
- Close Candle Alignment and Timeframe: Candles typically show minimal separation; a close alignment enhances their validity. Daily charts provide optimal identification.
Types of Harami Candlestick Patterns
Types of Harami Patterns are:
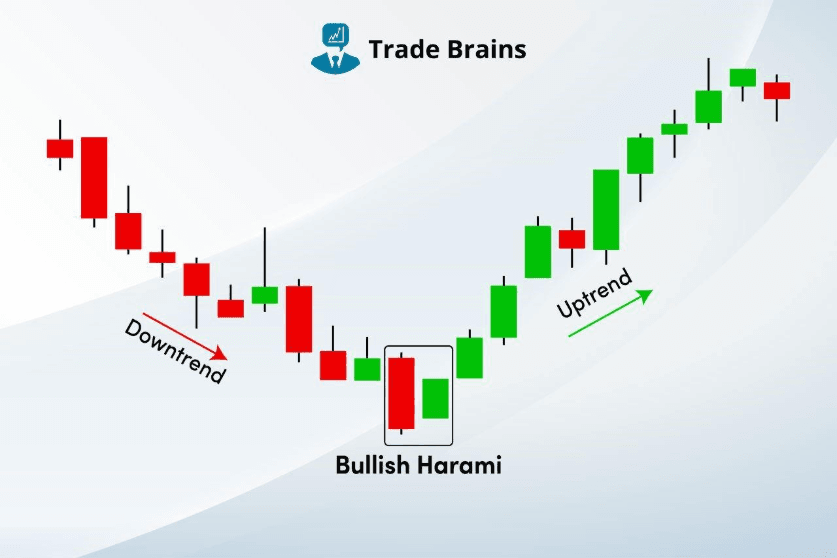
- Bullish Harami Candlestick Pattern: Bullish harami candle pattern develops at the end of a downtrend. The red candle shows that sellers controlled the market while the following smaller candle shows the growing buyer interest. It indicates that the trend will move upward.
- Bearish Harami Candlestick Pattern: This occurs at the peak of an uptrend. The large green candle shows buyer control, followed by a smaller candle indicating seller resurgence. It points to a potential downward move.
How Does the Harami Pattern Form?
Below is the step-by-step process of the Harami pattern formation.
Step 1: It begins with a large candle showing strong momentum. In a downtrend, a large red candle closes significantly lower, reflecting intense selling pressure.
Step 2: The next candle is smaller, with its opening and closing prices entirely within the prior candle's body, regardless of colour. A doji shape strengthens the signal.
Step 3: The price range contracts, signalling a reduction in directional force.
Step 4: The pattern spans two sessions and awaits reversal confirmation from the following candle. Such formations appear regularly on Nifty 50 charts after extended declines.
What Does a Harami Pattern Indicate?
The Harami pattern indicates the following.
- It signifies market indecision: following decisive action, participants pause, and the smaller candle illustrates equilibrium.
- Existing momentum diminishes: the initial candle's momentum reduces, allowing the opposing force to gain traction.
- A trend reversal becomes feasible: the bullish form anticipates gains, while the bearish form anticipates losses. Confirmation is essential.
- It may also denote temporary consolidation. Combine with RSI readings below 30 for enhanced bullish reliability.
Bullish Harami vs Bearish Harami
The table below highlights the structural and strategic differences between the bullish and bearish variations of the Harami pattern.
| Aspect | Bullish Harami | Bearish Harami |
| Formation Context | Conclusion of a downtrend, near support levels | Peak of an uptrend, near resistance levels |
| First Candle | Large red (bearish) body with substantial selling | Large green (bullish) body with substantial buying |
| Second Candle | Small body fully within the first; colour flexible | Small body fully within the first; colour flexible |
| Signal Direction | Potential buyer dominance and upward reversal | Potential seller dominance and downward reversal |
| Trading Implication | Initiate long positions above the Harami high | Initiate short positions below the Harami low |
How to Trade the Harami Candlestick Pattern?
To trade the Harami Pattern:
- Confirm identification: Ensure a distinct trend on daily or 4-hour timeframes; avoid sideways conditions.
- Seek validation: Check whether the third candle closes in the anticipated reversal direction, such as above the high for a bullish Harami candlestick pattern.
- Execute entry: Enter at the confirmation candle's close or minor retracement. Stock market trading apps facilitate timely alerts.
- Apply stop-loss: Position it immediately below the pattern low for bullish trades or above the high for bearish; limit risk to 1% of capital.
- Define targets: Pursue a 1:2 risk-reward ratio (e.g., 10:20). Employ a 20-period EMA for trailing stops.
Volume Confirmation in Harami Pattern
Volume is crucial for validating a Harami pattern. The first candle typically exhibits elevated volume, affirming the trend's underlying strength, such as excessive selling in a downtrend. The second candle displays reduced volume, indicating reduced participant interest. An increase in volume on the confirmation candle in the reversal direction can enhance confidence, for example, rising volume accompanying a bullish green candle. Persistently low volume suggests unreliability and potential false signals.
Advantages and Disadvantages Harami Candlestick Patterns
Like all technical patterns, the Harami offers distinct benefits but also comes with certain practical limitations.
| Advantages | Disadvantages |
| Straightforward visual identification required | Susceptible to failures in range-bound markets |
| Applicable across asset classes and timeframes | Demands confirmation for consistent accuracy |
| Provides early reversal alerts to manage risk | Interpretation of "small" body can be subjective |
| Integrates effectively with indicators | Less frequent in sustained trending conditions |
Conclusion
The Harami candlestick pattern provides an indication of potential market reversals through its distinctive two-candle configuration. It effectively captures indecision at trend endpoints. Traders can leverage it alongside volume analysis, confirmation signals, and disciplined risk management for improved outcomes. This approach suits various markets, including Indian indices like Nifty. Historical backtesting refines its application. For real-time charting and alerts, investors may consider a trusted stock market trading app to track patterns and execute trades efficiently.
- BlinkX launches ItsATraderThing Campaign
- blinkX Introduces 'Options Watchlist' to Empower Traders with Real-Time Insights
- BlinkX Enhances Trading with 24/7 Customer Support Capabilities
- Unlocking Seamless Trading: Introducing “Order Slicing” For The FnO Market
- A Game-Changer for Traders: Introducing Horizontal Watchlists
FAQ
Is the bullish harami a good or bad pattern?
The bullish harami serves as a potential reversal indicator, which emerges close to downtrend termination points, although its effectiveness relies on market conditions.
How to trade based on a bearish harami pattern?
The bearish harami pattern enables traders to initiate short positions after they achieve confirmation of pattern identification while using appropriate risk management techniques.
What is the psychology behind the Harami pattern?
The pattern may reflect a shift from strong directional momentum in the first candle to hesitation or reduced conviction in the second.
Can Harami patterns fail?
Yes, Harami patterns can fail, particularly when market context or broader conditions do not support a reversal.
What is the most powerful candlestick pattern?
There is no single candlestick pattern considered universally strong, as effectiveness varies by market context and timeframe.