What is Spinning Top Candlestick Pattern
- ▶Structure and Key Characteristics of Spinning Top
- ▶What Does the Spinning Top Candlestick Indicate?
- ▶Psychology Behind the Spinning Top Candlestick
- ▶How to Trade Using the Spinning Top Candlestick Pattern?
- ▶Spinning Top in an Uptrend
- ▶Spinning Top in a Downtrend
- ▶Spinning Top in Sideways or Range-Bound Markets
- ▶Advantages and Disadvantages of Spinning Top Candlestick Pattern
- ▶Common Mistakes Traders Make with Spinning Top Candlesticks
The spinning top candlestick pattern is a neutral and single-candle formation that indicates indecision of the market and uncertainty regarding future price direction. This candle is created with a small real body and two long shadows, one on the top and one at the bottom, indicating that neither buyers nor sellers gained control during the trading session.
Spinning tops are very common around trend peaks, bottoms, or periods of consolidation, where early warning signs of weakening momentum appear on charts, but always need further confirmation from other candlesticks to find positions. This article explains everything traders need to know about the spinning top candle meaning and its role in technical analysis.
Structure and Key Characteristics of Spinning Top
After understanding the spinning top candle meaning, let’s understand its structure and key characteristics.
- Small Real Body: It refers to the candle that has a small real body where the opening and closing prices have a minimum difference, showing very minimal change in price between the beginning and end of the session.
- Long Upper and Lower Shadows: Both shadows extend significantly in each direction, showing that buyers pushed prices up while sellers pushed them down, yet neither side managed to dominate by the session's close.
- Colour Relevance: The candle can be bullish-green/white when the close is higher than the open or bearish-red/black when the close is lower than the open. However, the colour is important because both types are indecision candles and not directional bias.
- Volatility Context: The pattern occurs when the market has large intraday price swings and then finishes near the open, showing active trading without any resolution between the bulls and bears. This behaviour is commonly analysed within broader candlestick patterns in trading.
- Equal Shadow Length: It is not required that the length of the shadows be perfectly equal, but they do need to be in balance with one another to some extent, qualifying it as a spinning top rather than any other types of candlestick patterns containing single dominant shadows.
What Does the Spinning Top Candlestick Indicate?
The spinning top candle pattern provides several important market signals that traders interpret based on context:
- Market Indecision: The pattern indicates that neither buyers nor sellers have active control over price direction, with both sides trying to get the position of power without achieving dominance, leading traders to question whether the spinning top pattern bullish or bearish outcome will emerge.
- Trend Pause: A spinning top appearing in an established trend is indicative that the momentum may be at a pause or weakening, thus showing some loss of the prevailing force.
- Loss of Momentum: The formation is a signal that the strength behind the existing trend is losing steam, as evidenced by the inability to hold the gains or losses obtained during the session.
- Potential Reversal Signal: The spinning top can warn traders about an upcoming crucial change in trend direction, though confirmation from the next candle is important to determine whether prices will reverse or continue.
- Sideways Movement Indication: The pattern displays indecision with many possible sideways movements, particularly when appearing within range-bound markets rather than trending conditions.
Also Read: Bullish Candlestick Patterns
Psychology Behind the Spinning Top Candlestick
During the formation of a spinning top, buyers push prices high at some point in the session whilst sellers simultaneously push them low, creating long shadows in both directions. However, by the session's close, neither group maintains their leverage, resulting in a closing price near the opening level. This dynamic indicates that both bulls and bears were active participants during the trading period, yet the tension between them prevented either side from establishing control. This helps explain the spinning top pattern bullish or bearish debate among traders.
The uncertainty through the spinning top comes because of the inability of traders to sustain price movement in either direction. The bulls try forcing prices upward, but bears counter the moves quite effectively, and vice versa. It is this back-and-forward kind of action that forces the closing price back toward the opening price to create the small body characteristic of the pattern. When this pattern appears, it sets restlessness within the dominant group, as they might have expected continuation rather than this indecisive outcome, especially after strong directional moves.
How to Trade Using the Spinning Top Candlestick Pattern?
Here is how one can trade the spinning top candlestick pattern
Step 1: Location Identification
Identify where the spinning top appears on the chart. The pattern becomes more meaningful when forming after a strong move or near key price levels such as support and resistance zones. In trending markets, spinning tops indicate weakening momentum, while in sideways markets, they reflect existing indecision.
Step 2: Confirmation Candles
Never trade immediately upon a spinning top formation. Wait for the next candle to confirm the direction. If confirmation is bullish, it shall be by way of a candle closing over the high of the spinning top. If the confirmation is bearish, it shall occur as a candle closing below the spinning top's low. This confirmation helps to identify whether indecision resolves into a reversal or continuation, a concept often studied in candlestick patterns in trading.
Step 3: Place Stop-Loss
For long trades after bullish confirmation, set the stop-loss below the low of the spinning top. In the case of short trades after bearish confirmation, set stop-loss above the high of the spinning top. These levels mark those where the pattern has failed, and the price has reversed against the position.
Step 4: Trade Direction Bias
Combine the spinning top with technical indicators such as RSI, MACD, or moving averages to derive information about the strength of a trend and, correspondingly, the direction of the trade bias. Confirm that volume rises during confirmation to gain confidence in the signal.
Step 5: Risk Management
Set profit targets using tools like pivot points, Fibonacci extensions, or nearby resistance and support levels. Always set stop-loss orders to protect the position from adverse movements.
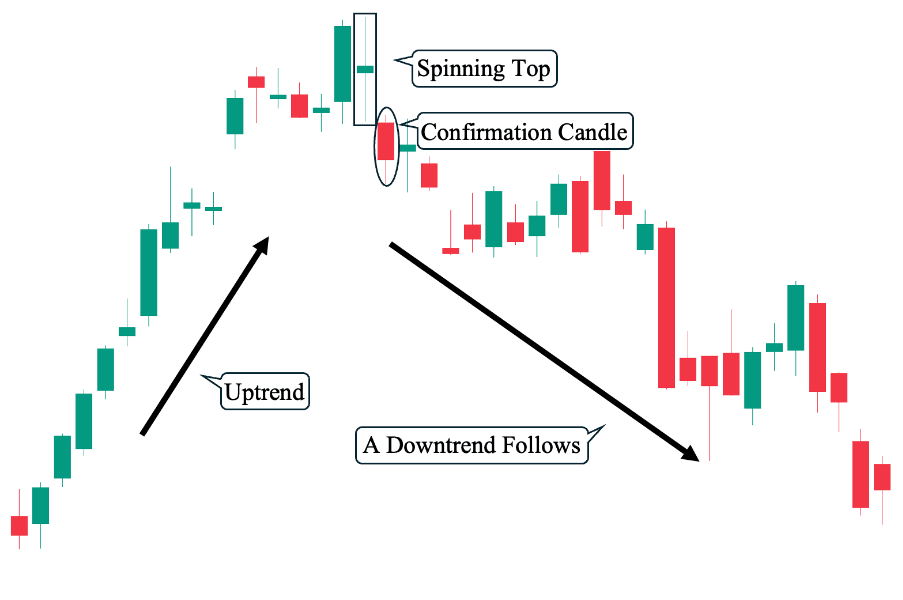
Spinning Top in an Uptrend
The appearance of a spinning top after a series of bullish candles signals that buyers are losing strength and momentum. The long upper and lower shadows suggest that bulls attempted to push prices higher, but bears managed to push them back down before the session's end. This pattern at the peak of an uptrend denotes the bulls' weakness and indicates a potential trend change or interruption.
However, the spinning top alone does not confirm a reversal, which is why traders should not assume the spinning top pattern bullish or bearish direction without confirmation. Traders should wait for a bearish confirmation candle that closes below the spinning top's low to validate that sellers are gaining control. If the subsequent candle continues upward, the pattern may simply indicate temporary consolidation rather than trend reversal, signalling that bullish market sentiment remains intact.
Spinning Top in a Downtrend
When a spinning top appears after a decline, it indicates that selling pressure may be slowing and sellers are losing control. Although bears push the price lower during the session, bulls manage to recover lost ground, closing the session near the opening price. This suggests that the downtrend momentum is weakening, and bears may be losing their grip on the market.
For traders considering reversal opportunities, confirmation becomes important. A bullish confirmation candle closing above the spinning top's high supports a possible trend reversal to the upside. However, if the spinning top is followed by another bearish candle, it may serve as a continuation pattern, signifying bearish sentiment.
Spinning Top in Sideways or Range-Bound Markets
The spinning top appearing at the time of sideways movement or inside an established range usually points to existing indecision rather than giving any valid directional signals. Neither buyers nor sellers are in control, and the pattern reflects the low momentum that is typical in range-bound conditions.
In these scenarios, signals from spinning tops are considerably weak and less reliable for predicting trend changes. The pattern becomes expected during consolidation, as market sentiment is unclear, making it one of the more frequently observed candlestick patterns in trading during non-trending phases. Traders should be careful when understanding spinning tops in non-trending markets, as they may simply indicate continued ranging behaviour rather than impending breakouts or reversals. The pattern can signal a period of consolidation where price trades within defined boundaries.
Advantages and Disadvantages of Spinning Top Candlestick Pattern
The following table highlights some of the pros and cons of the spinning top candlestick pattern.
Advantages of Spinning Top Candlestick Pattern | Disadvantages of Spinning Top Candlestick Pattern |
| Provides early indications of potential trend movements and trend reversals, allowing traders to plan their strategies well before the trend fully develops. | The pattern alone may not provide a clear directional signal, and traders need to wait for subsequent candles, which can delay entry and potentially miss optimal entry points. |
| The distinctive structure with a small body and long shadows makes the pattern relatively easy to spot on charts, even for beginner traders. | Spinning tops occur frequently on charts, particularly in volatile markets, making it difficult to distinguish significant patterns. |
| Can be applied across all timeframes and markets, from intraday to swing trading, and works with various asset classes. | The pattern's meaning varies significantly based on trend context, requiring traders to analyse broader market conditions rather than relying solely on the pattern. |
| Provides clear points of reference for the placement of stop-loss at either the high or low of the pattern, allowing for proper risk management. | They often produce false signals in sideways markets or without confirmation, leading to losing trades. |
| Works effectively when combined with technical indicators like RSI, MACD, and moving averages to strengthen trading decisions. | No fixed definition exists for how small the body should be or how long shadows should extend, leading to subjective pattern identification. |
Common Mistakes Traders Make with Spinning Top Candlesticks
The following are some of the common mistakes traders make with the spinning top candlestick pattern:
Trading Without Confirmation
The common mistake involves entering positions immediately upon spinning top formation without waiting for the next candle to confirm direction. Since the pattern signals indecision rather than direction, premature entry may result in losses when the market moves against the position.
Ignoring Trend Context
Traders sometimes identify spinning tops without considering whether they appear in uptrends, downtrends, or sideways markets. The pattern's significance changes based on location, and ignoring this context may lead to misinterpretation of signals.
Over-reliance on Single Candles
Depending solely on the spinning top pattern without incorporating other technical analysis tools, support-resistance levels, or indicators reduces accuracy.
Neglecting Risk Management
Failing to set appropriate stop-losses at the pattern's high or low points may lead to risk. Proper risk management is important since spinning tops can produce false signals, particularly in volatile conditions
Misidentifying the Pattern
Confusing spinning tops with dojis or other candlestick patterns due to a lack of clear definition regarding body size and shadow length. This misidentification leads to incorrect trading decisions based on wrong pattern assumptions.
Disclaimer: All investments are subject to market risks, economic conditions, regulatory changes, and other external factors. Returns are not guaranteed and may vary based on market performance and investment tenure. Investors should assess their risk tolerance and financial objectives, conduct their own research, and consult a qualified financial advisor before making any investment decisions.
To build a strong foundation in technical analysis, explore our detailed guide on 35 powerful candlestick patterns in the stock market and learn how traders interpret price movements effectively.
Conclusion
The spinning top candlestick pattern signals indecision through its small body and long wicks. Understanding the spinning top candle meaning can help traders interpret market uncertainty more effectively. It reflects balanced buyer and seller activity, often appearing during trend pauses or uncertainty. While useful for identifying potential shifts, it requires confirmation and contextual analysis.
- BlinkX launches ItsATraderThing Campaign
- blinkX Introduces 'Options Watchlist' to Empower Traders with Real-Time Insights
- BlinkX Enhances Trading with 24/7 Customer Support Capabilities
- Unlocking Seamless Trading: Introducing “Order Slicing” For The FnO Market
- A Game-Changer for Traders: Introducing Horizontal Watchlists
FAQs on Spinning Top Candlestick Pattern
How do you confirm a spinning top signal?
Confirm a spinning top signal by waiting for the direction of the next candle. Confirm bullish when the candle following the spinning top closes above its high, and confirm bearish when the candle following it closes below its low.
Is the spinning top candlestick bearish or bullish in nature?
The spinning top is neither bearish nor bullish; it is a neutral pattern. The colour (green or red) has minimal significance as both variations signal market indecision rather than directional bias.
How do you find the spinning top candlestick pattern?
Traders can find the spinning top by looking for candlesticks with small bodies where open and close prices are near each other, combined with long upper and lower shadows extending from both ends
Why does the spinning top pattern show indecision?
This pattern reflects indecision because the buyers push the prices up while the sellers push them down during the session, but neither side maintains it, closing it almost at the opening price.
Can spinning top patterns signal a trend change?
Yes, spinning top patterns can indicate potential reversals if they occur at the peak or bottom of a trend. However, confirmation from the subsequent candle is important in order to validate the reversal before trading.