35 Powerful Candlestick Patterns in the Stock Market
Candlestick patterns are some of the most common forms of technical analysis that aid traders in recognizing any possible trend or reversal patterns within the market. Learning about these patterns can give you an idea of how the market will perform. This article will discuss 35 such types of candlestick patterns that are used by traders today.
What are Candlestick Patterns?
The candlestick pattern refers to a pattern that results from using one or more candlesticks. This pattern gives the trader an insight into how the battle is being waged between the bulls and bears and if it is likely to continue in the same direction or change its path. The power of the 35 candlestick patterns will enable the traders to make wise investments in any stock, commodity, or foreign exchange market.
The use of candlestick patterns can help the trader understand the psychology of the market.
Table of Contents
Basics of Candlestick Chart
Candlestick charts are among the most commonly used tools in technical analysis. A single candlestick is used to show the price action of a security for a certain period and includes the following four main components: opening price, closing price, highest price, and lowest price.
When a candlestick appears green (bullish), this shows that the security closed higher than its opening price; conversely, when a red (bearish) candlestick is seen, it means the security closed lower than its opening price. This knowledge is very important before learning the 35 candlestick formations.
Types of Candlestick Patterns
The 35 strong candlestick formations can be generally grouped into three types depending on the information they generate:
- Bullish Candlestick Patterns: Signal the emergence of an upturn or reversal in price.
- Bearish Candlestick Patterns: Signal the occurrence of a downturn or reversal in price.
- Continuation Candlestick Patterns: Signal a continuation of the existing trend despite a brief interruption. Eg, spinning top pattern
Knowing these types can help one analyze charts effectively and align with prevailing trends in the market.
Bullish Candlestick Patterns
Bullish candlestick patterns normally emerge following a downtrend and are usually indicative of possible buyers taking the lead in the market.
The most common of the 35 extremely powerful candlestick patterns used for bullish formations are:
- Hammer
- Bullish Engulfing
- Morning Star
- Piercing Line
- Three White Soldiers
These types of patterns can be employed by traders in conjunction with volume and support levels for confirmation purposes.
Bearish Candlestick Patterns
Bearish candlestick patterns typically come after an uptrend and imply increased selling pressure in the market. The presence of such patterns is associated with diminishing bull power and possible reversal of the prevailing trend.
Among the thirty-five candlestick patterns, some bearish patterns that traders commonly watch out for include:
- Shooting Star
- Bearish Engulfing
- Evening Star
- Dark Cloud Cover
- Three Black Crows
Continuation Candlestick Patterns
The continuation candlestick patterns show that the current trend is expected to continue after some consolidation time. They ensure that traders do not exit winning trades prematurely.
Some of the continuation candlestick patterns among the 35 power candlestick patterns are:
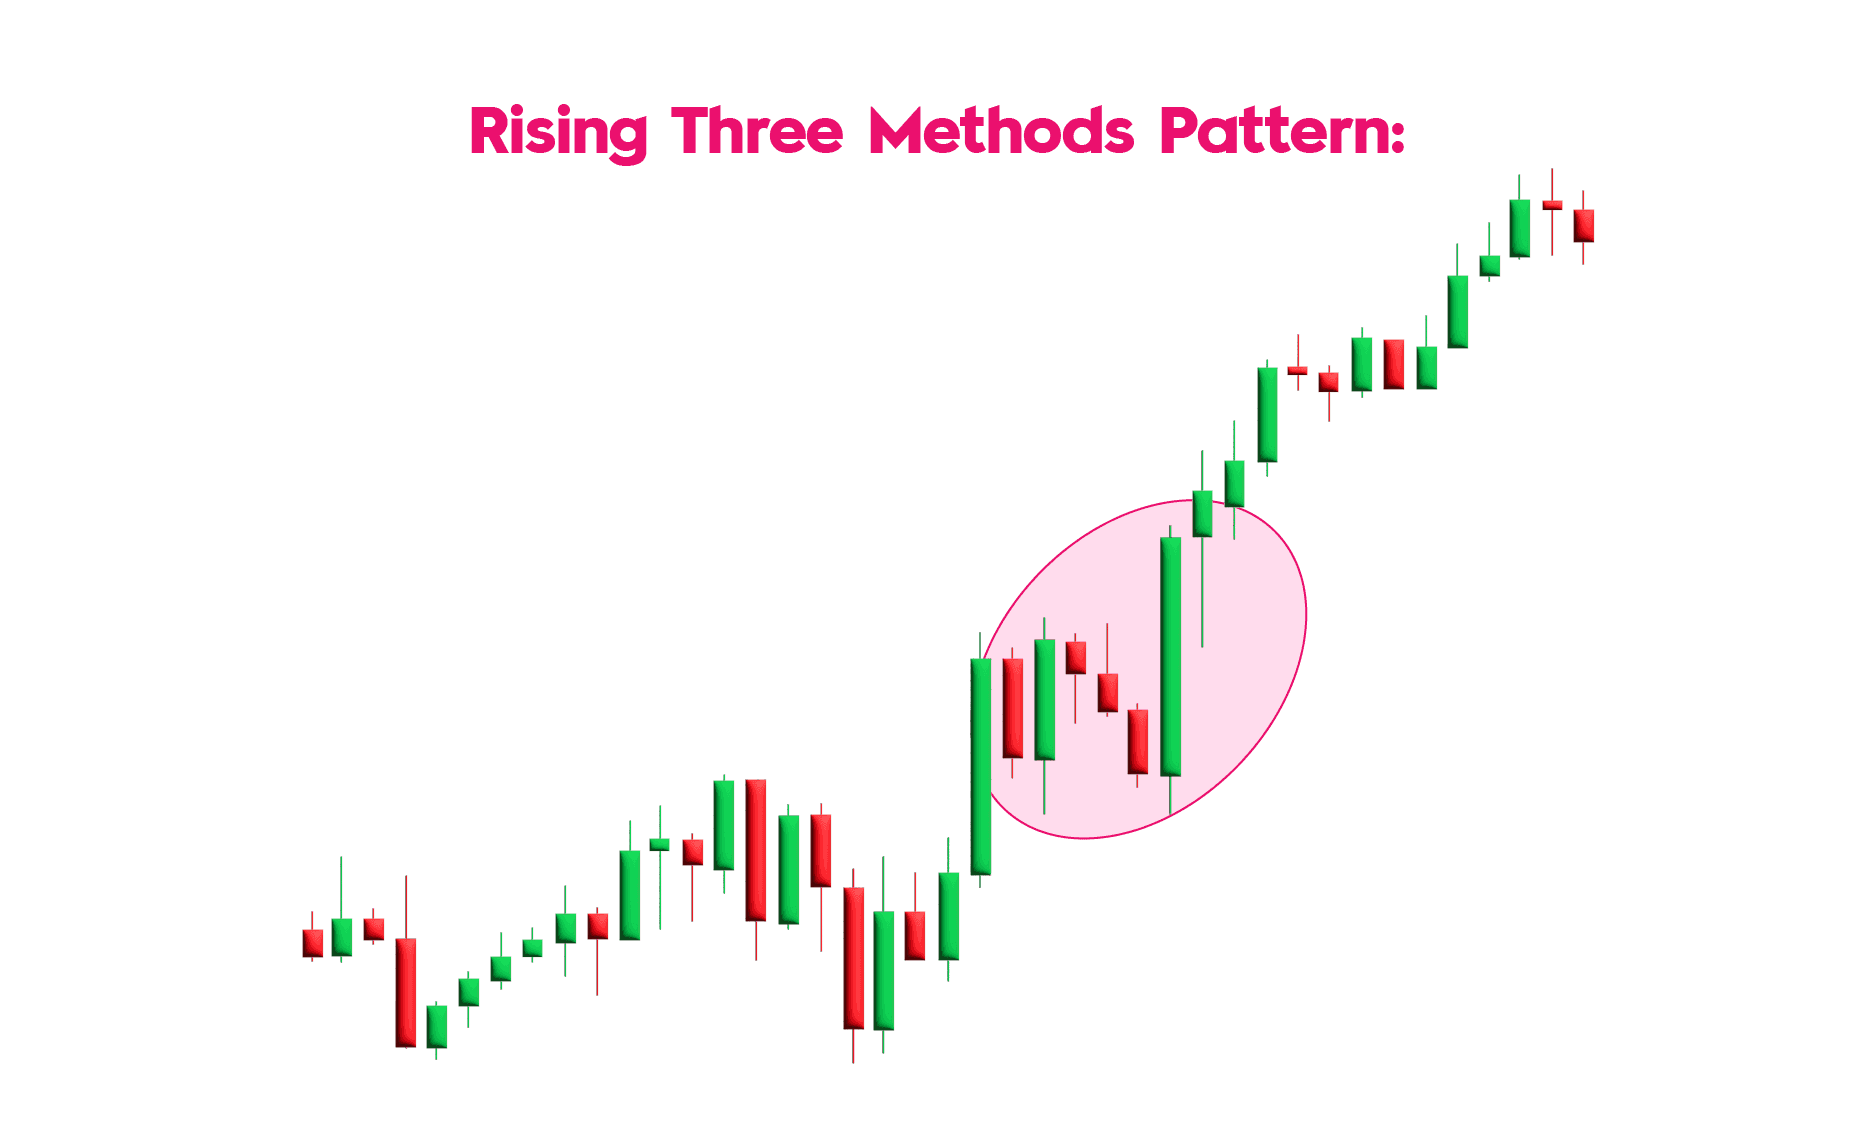
- Rising Three Methods
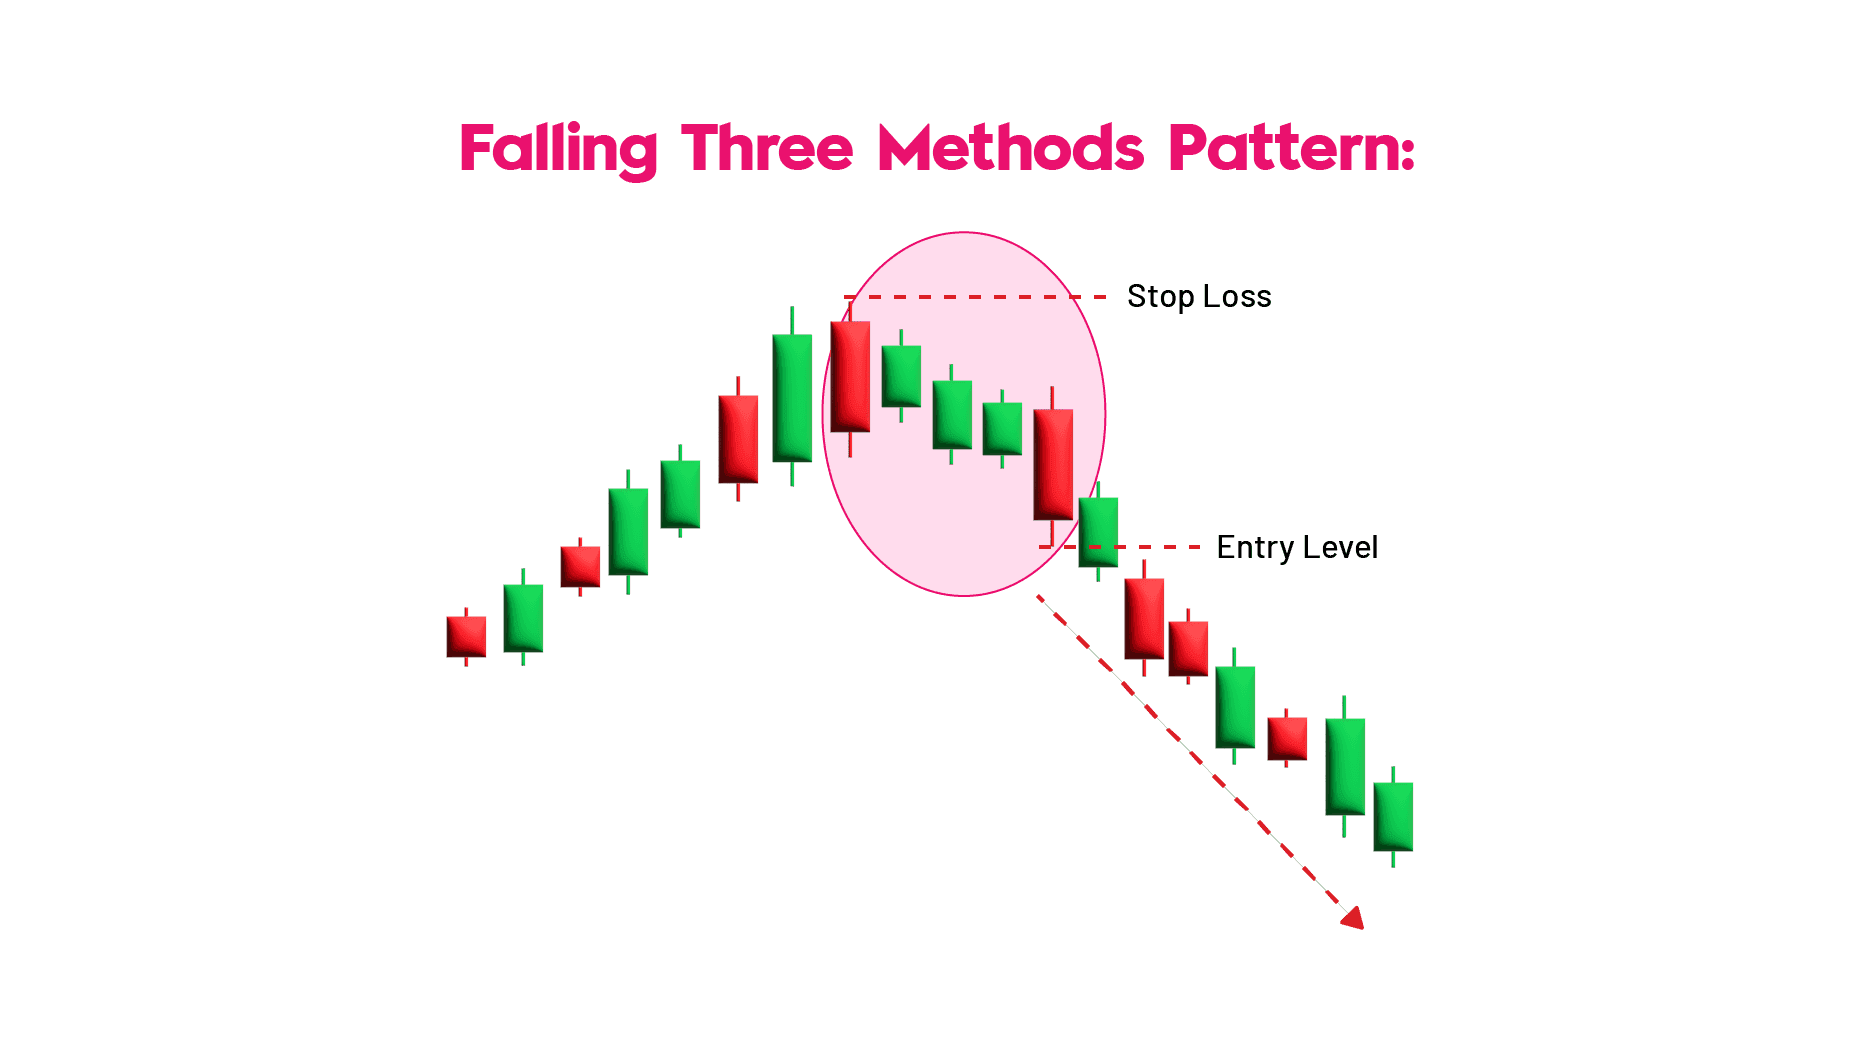
- Falling Three Methods
- Mat Hold Pattern
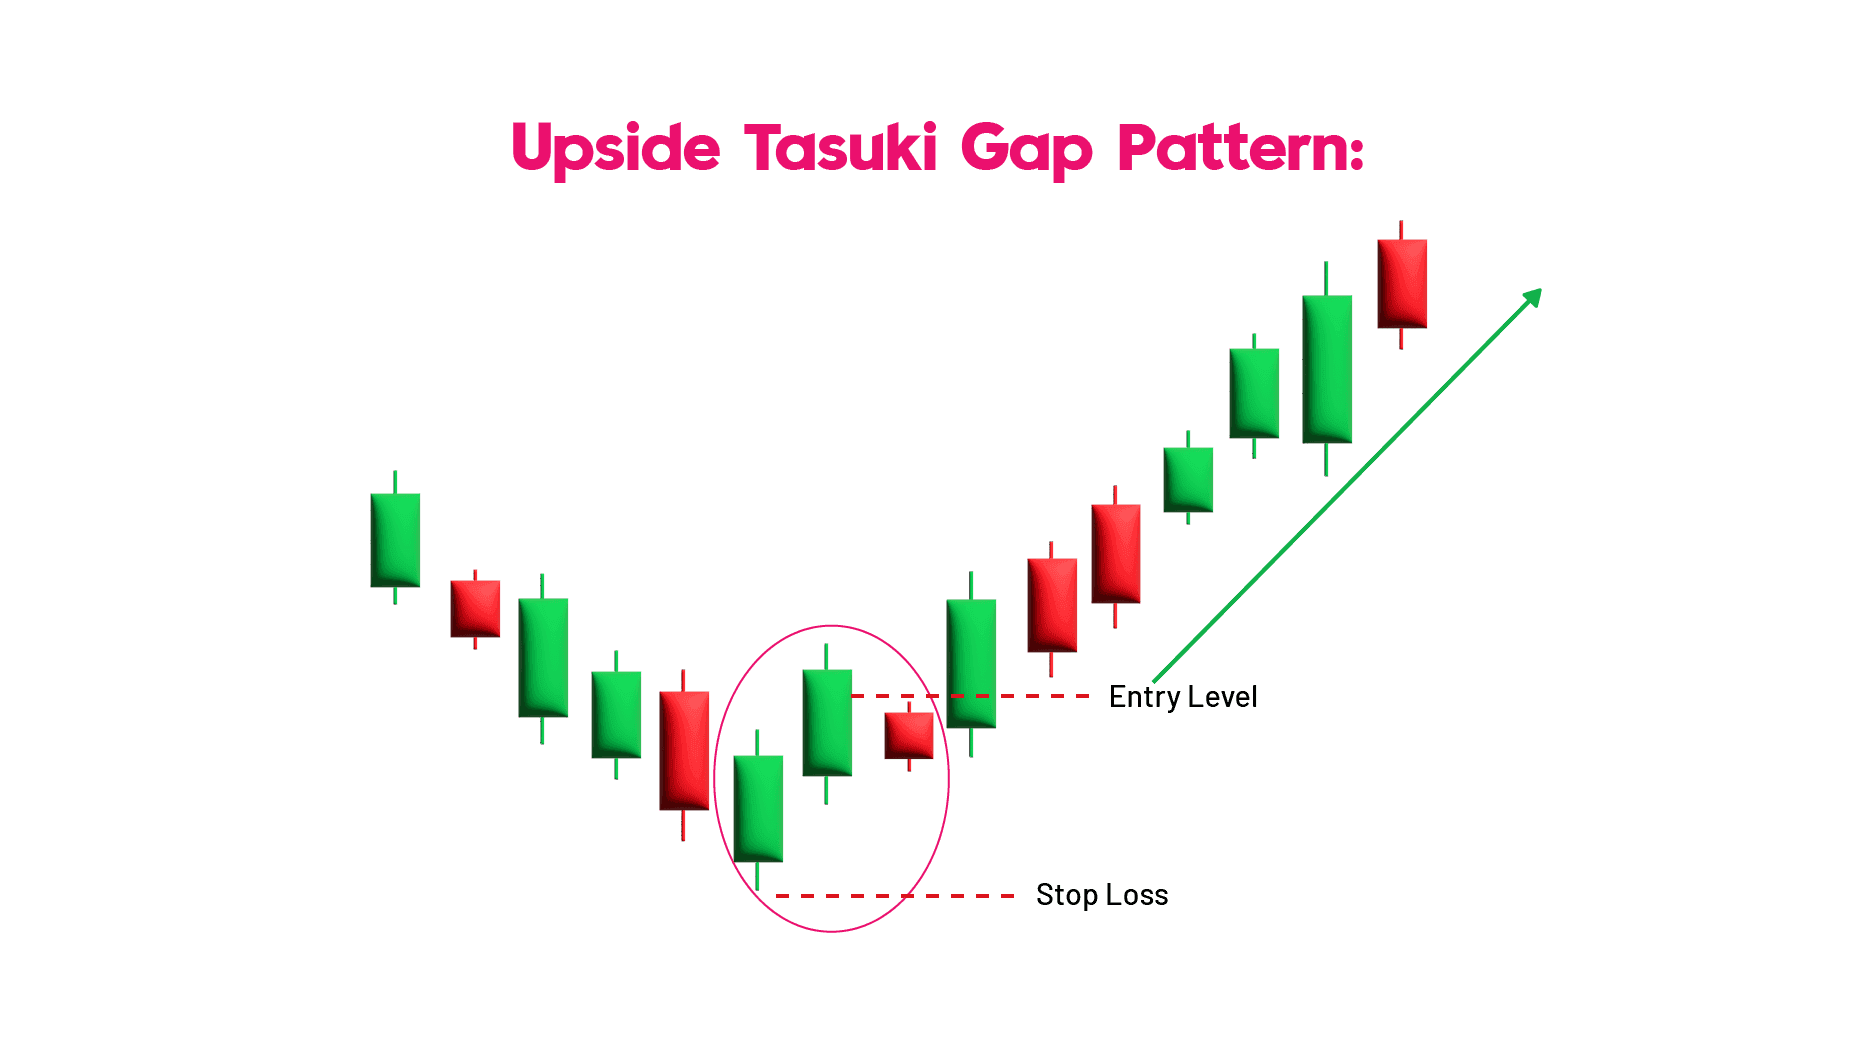
- Tasuki Gap
They are important for trend traders who benefit from the strong momentum in the market.
35 Candlestick Patterns
Candlestick patterns which include bullish and bearish reversal, and continuation formation have become essential for the investors and traders that help predict market movements. Below are 35 powerful candlestick patterns presented in a table.
Pattern Type | Pattern Name | Description |
| Bullish Reversal Pattern | Hammer | This happens when the price trade gets lower from its original price but gets too close near the opening price, with a lower shadow at least twice the size of the body. |
| Piercing Pattern | This is made by two candles after a downtrend, where the second bullish candle closes more than 50% compared to the earlier bearish candle. | |
| Bullish Engulfing | Two candles where the second bullish candle engulfs the body of the previous bearish candle, indicating a trend reversal. | |
| The Morning Star | Three-candle pattern indicating a bullish reversal: bearish first candle, doji second, and bullish third candle. | |
| Three White Soldiers | Three consecutive long bullish candles indicating a reversal of a downtrend. | |
| White Marubozu | A single long bullish candle with no shadows, indicating strong buying pressure and a potential trend reversal. | |
| Three Inside Up | A three-candle pattern: bearish first candle, small bullish second candle within the first, and a long bullish third candle confirming reversal. | |
| Bullish Harami | Two candles where the first bearish candle is followed by a smaller bullish candle within the range of the first, signalling a reversal. | |
| Tweezer Bottom | Two candles with equal bottoms, signalling a reversal of a downtrend. | |
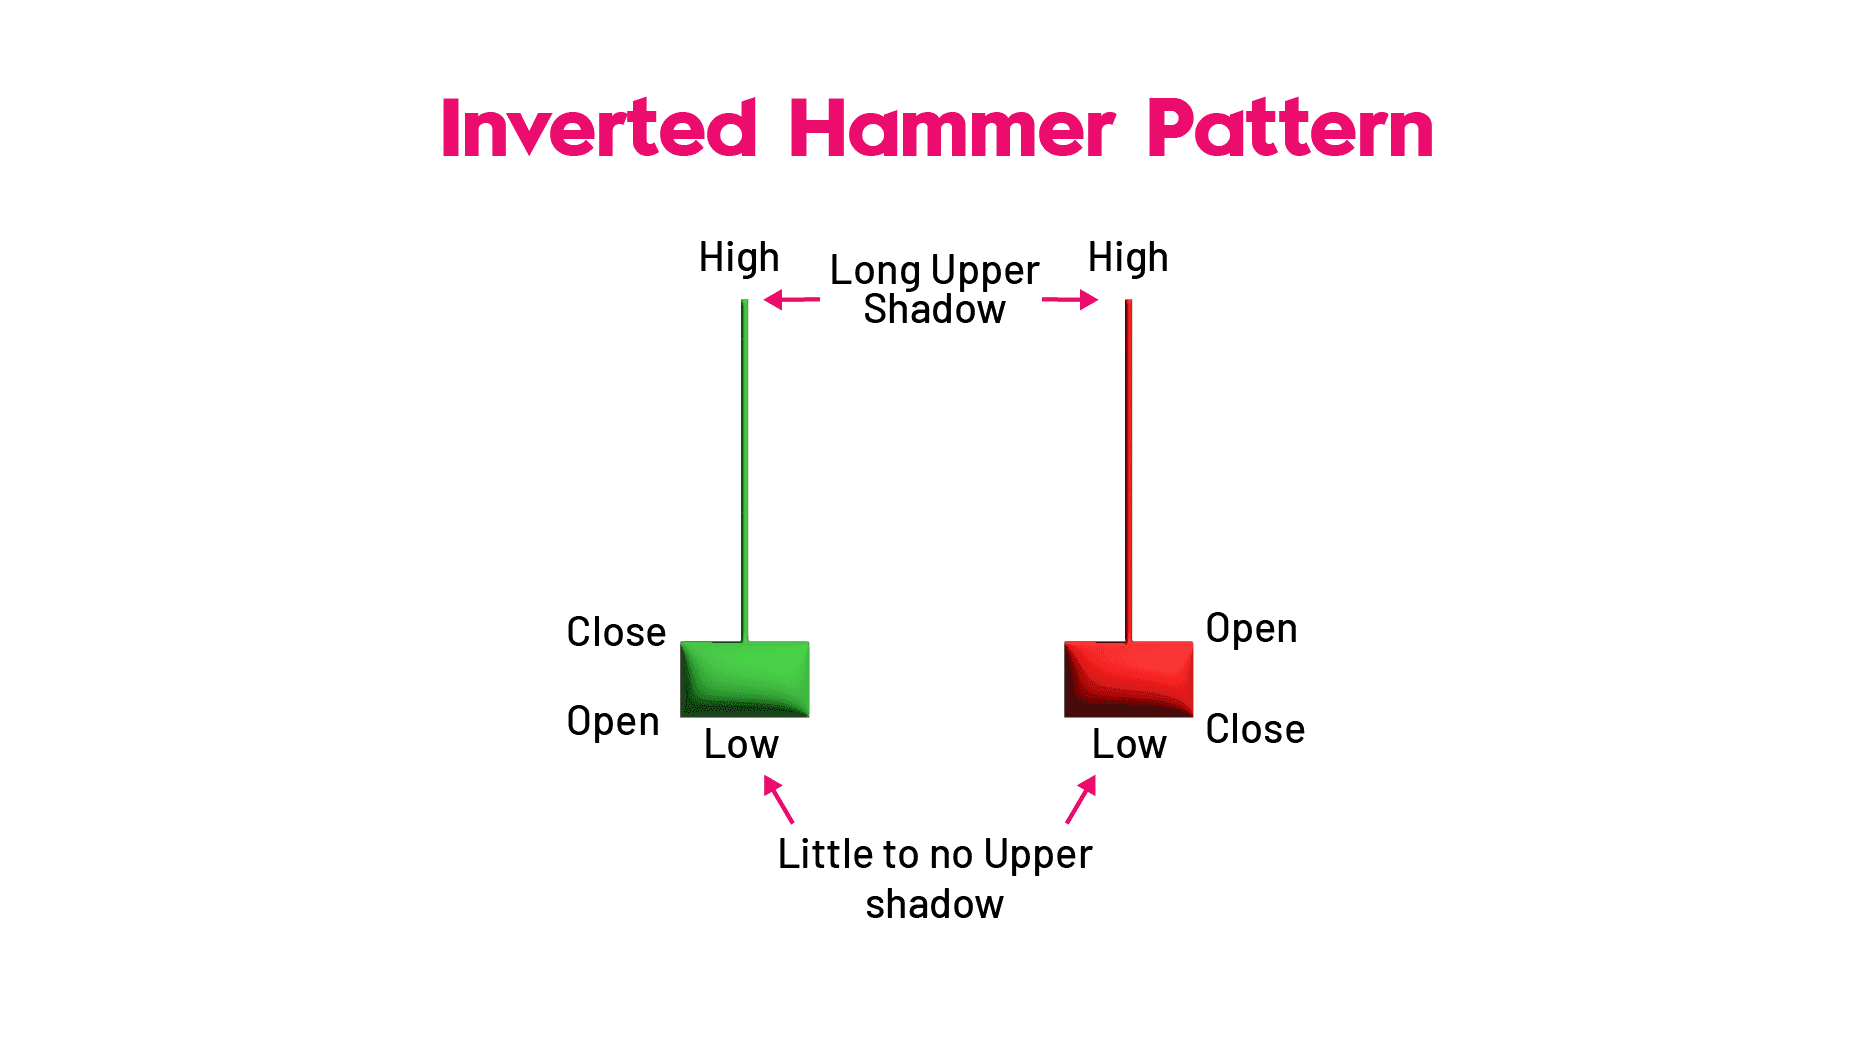
| Inverted Hammer | Appears at the bottom of a downtrend with a small body, long upper wick, and short lower wick, indicating potential reversal. | |
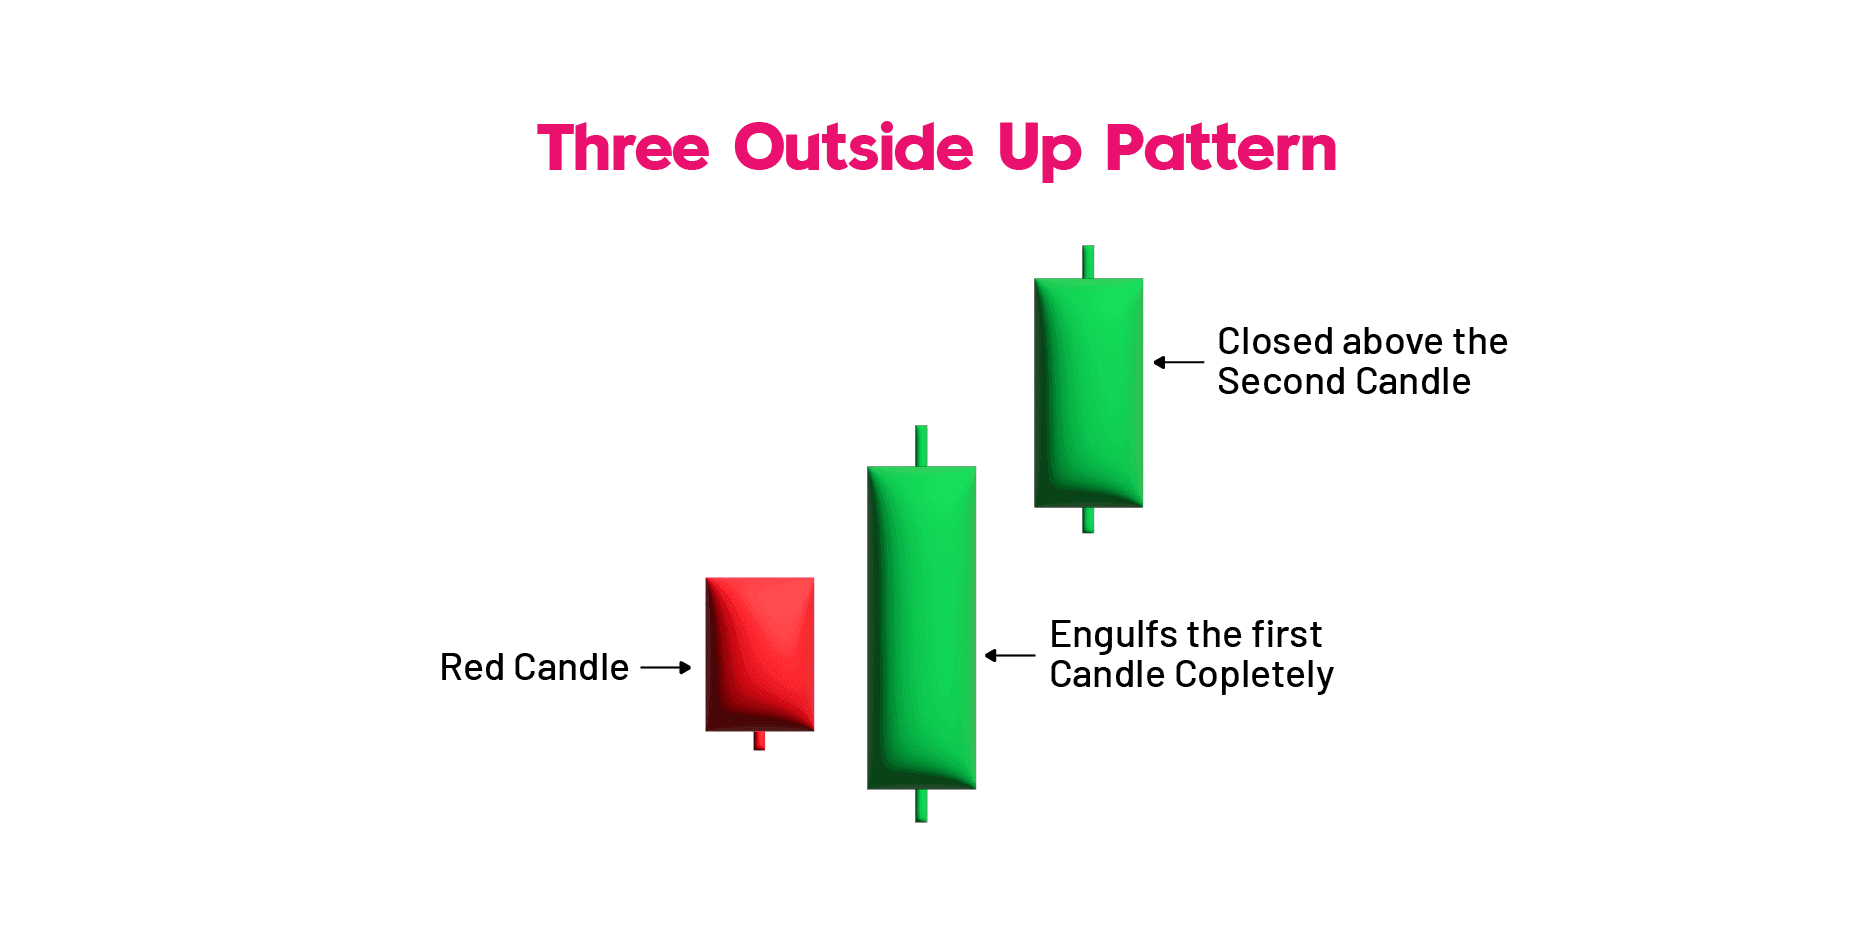
| Three Outside Up | Three candles: bearish first, bullish second engulfing the first, and a third confirming bullish reversal. | |
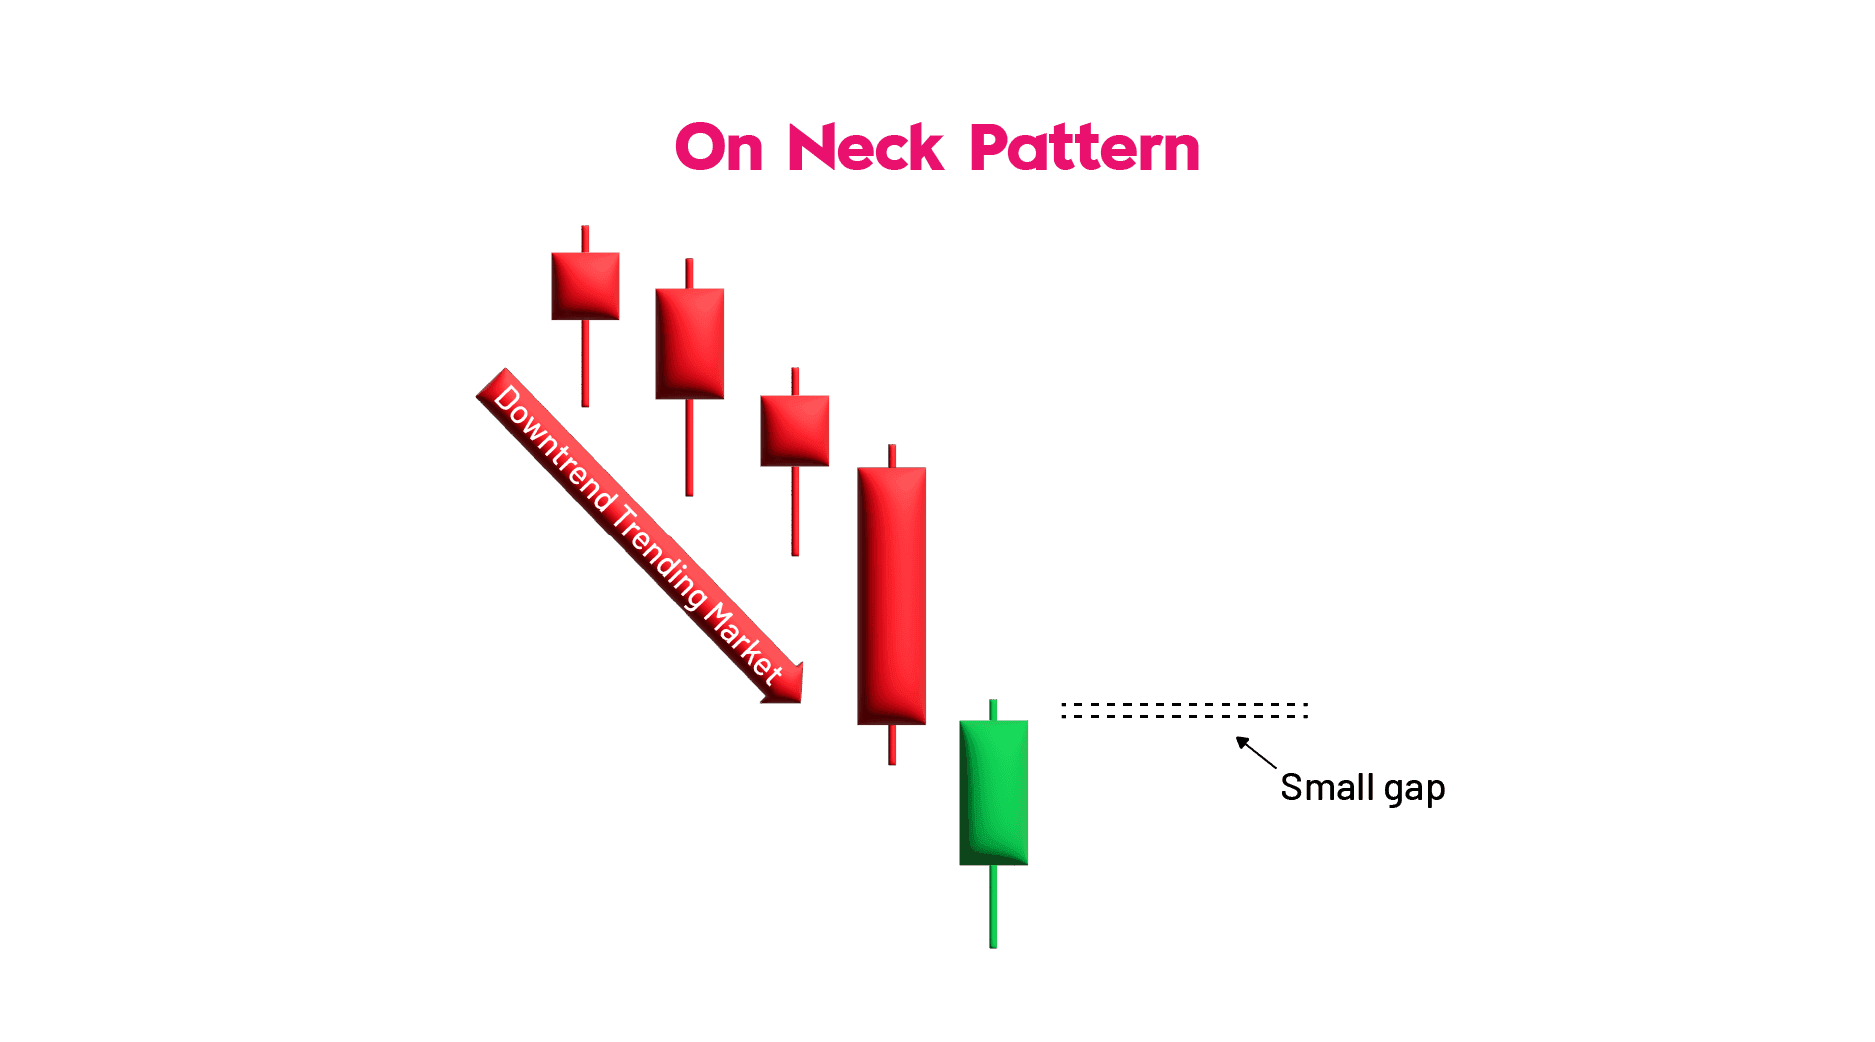
| On Neck Pattern | After a downtrend, a long bearish candle followed by a small bullish candle closing near the previous close. | |
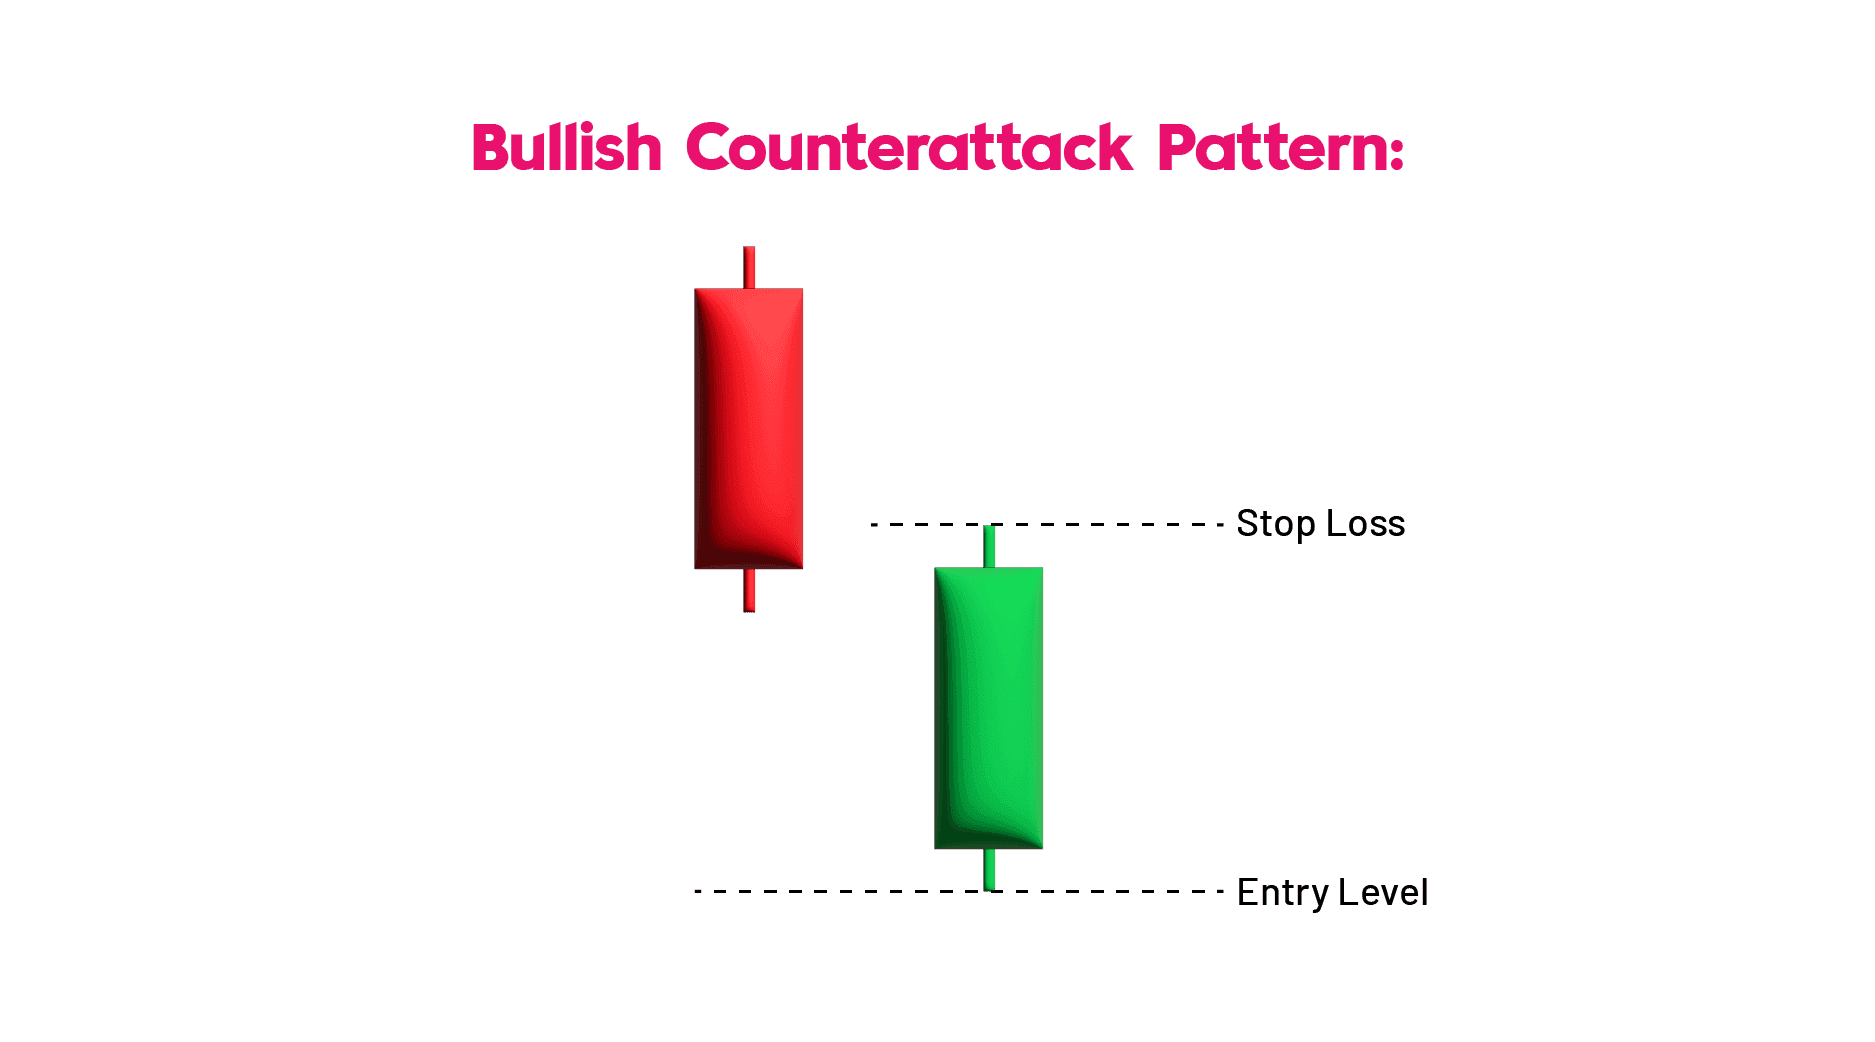
| Bullish Counterattack | Two-candle pattern predicting a reversal in a downtrend, with the second bullish candle closing above the first bearish candle's close. | |
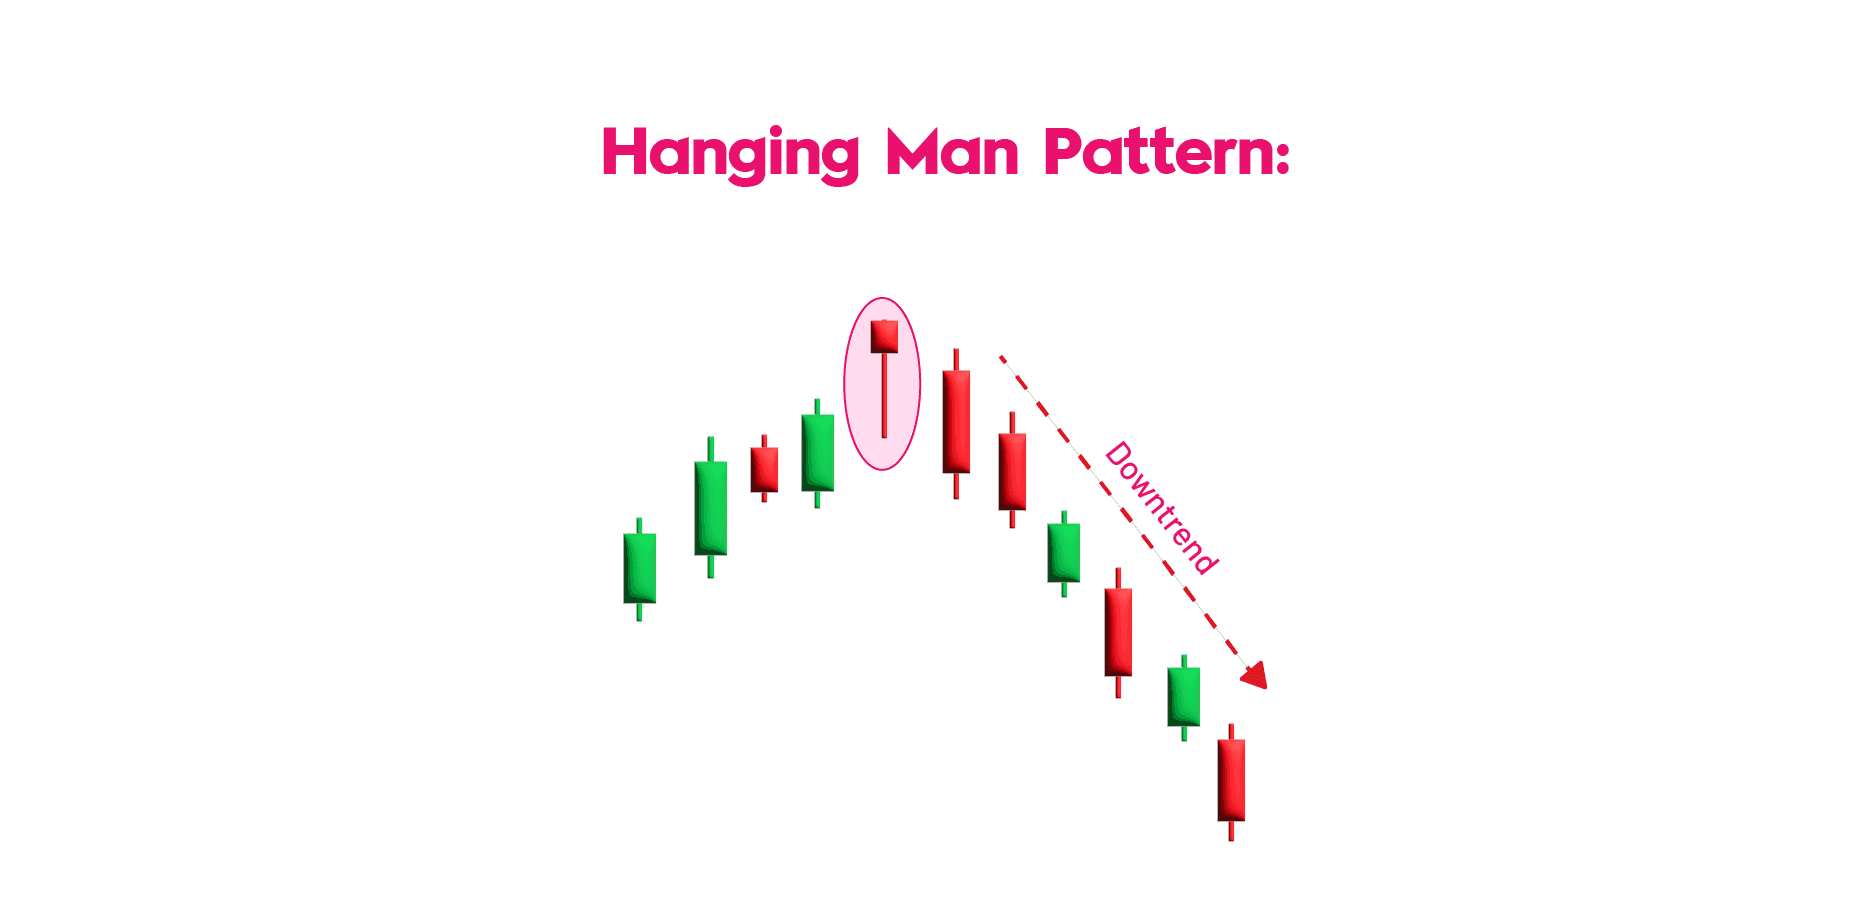
| Bearish Reversal Pattern | Hanging Man | Forms at the end of an uptrend with a small body and long lower shadow, indicating a bearish reversal. |
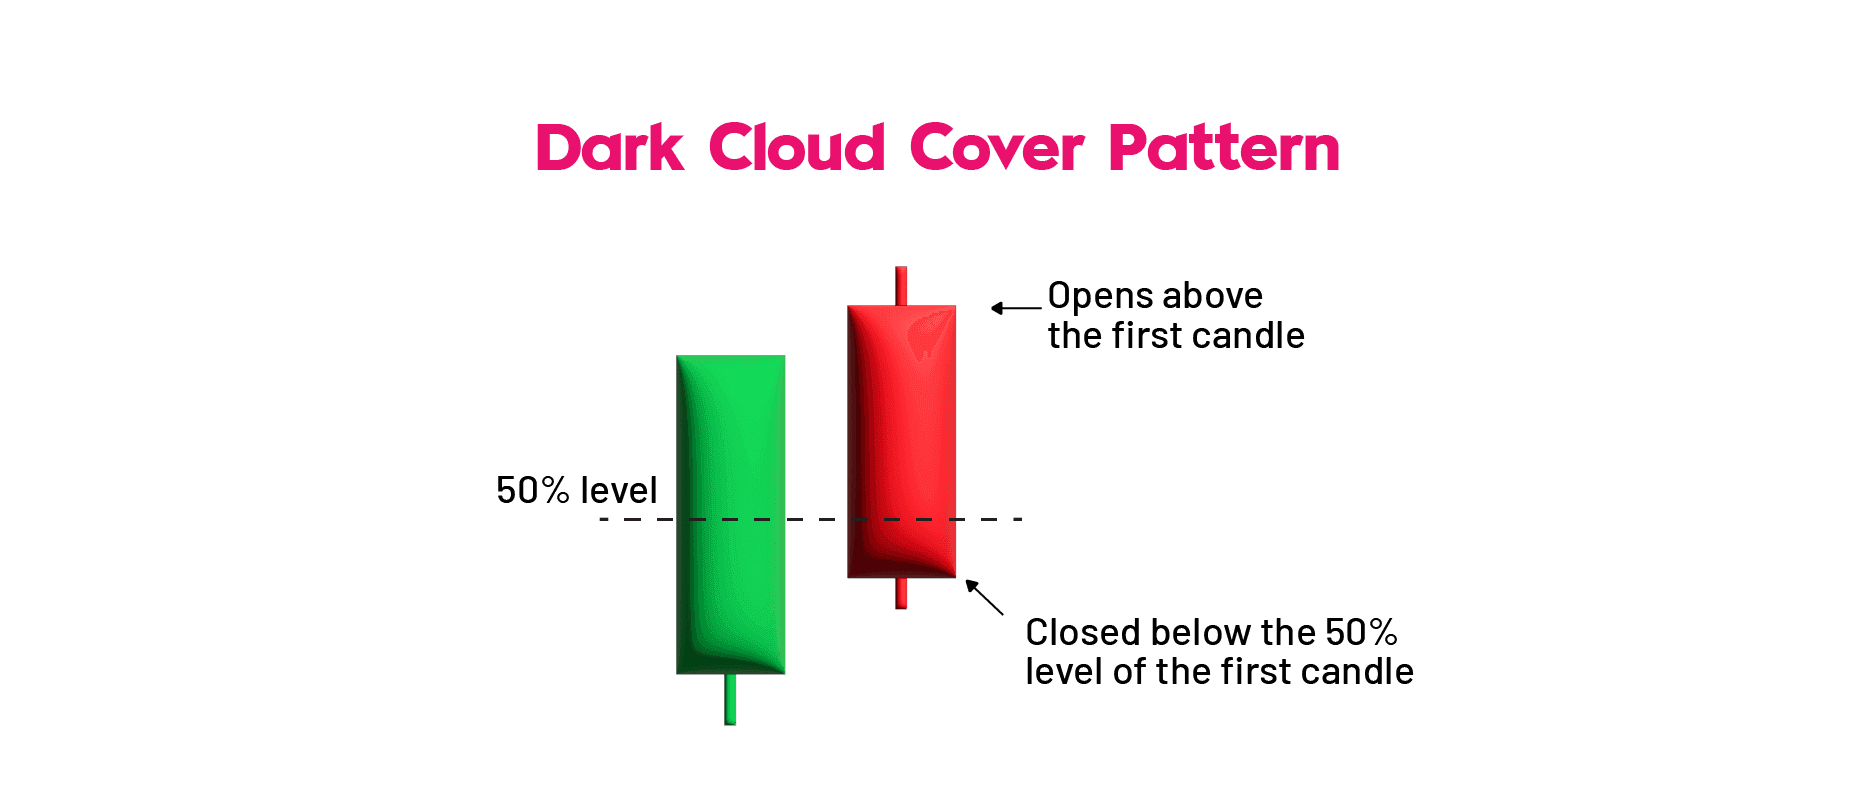
| Dark Cloud Cover | Two-candle pattern with a bearish second candle closing below the midpoint of the first bullish candle, signalling reversal. | |
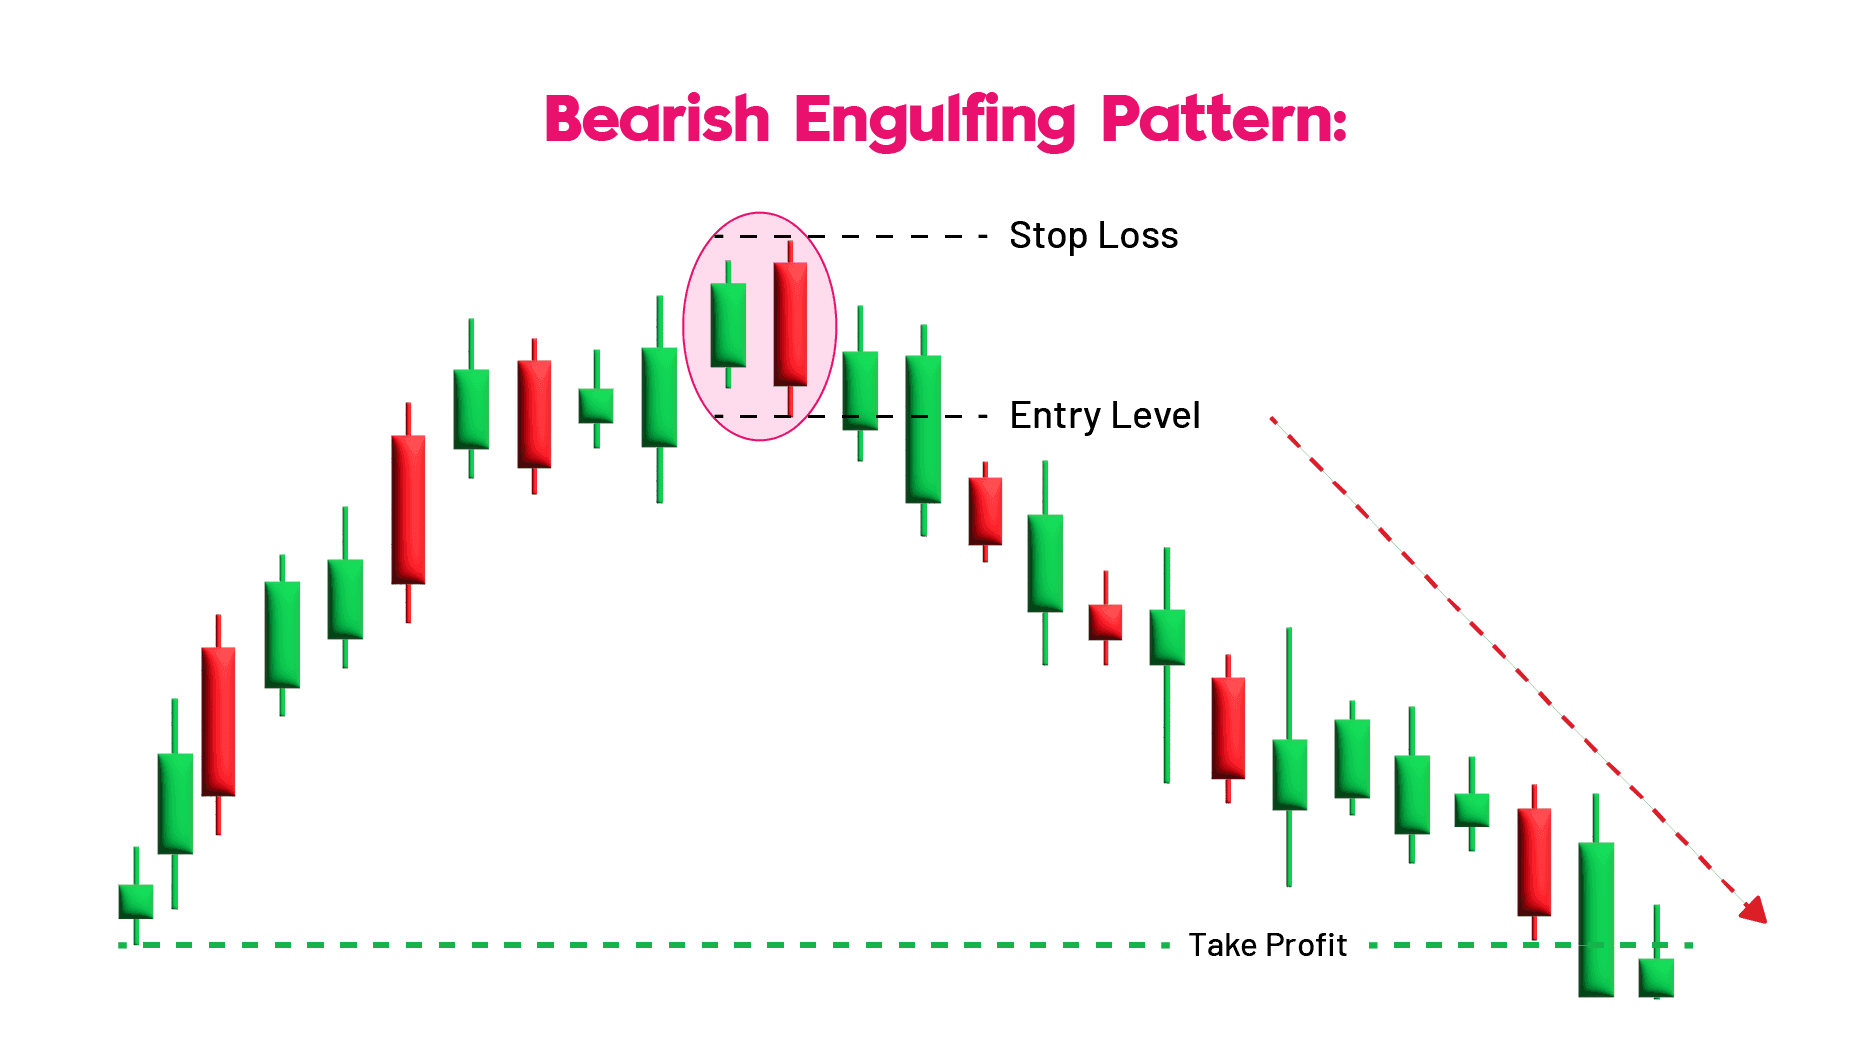
| Bearish Engulfing | Two candles where the second bearish candle engulfs the first bullish candle, indicating a trend reversal. | |
| The Evening Star | Three-candle pattern: bullish first candle, doji second, and bearish third candle indicating reversal. | |
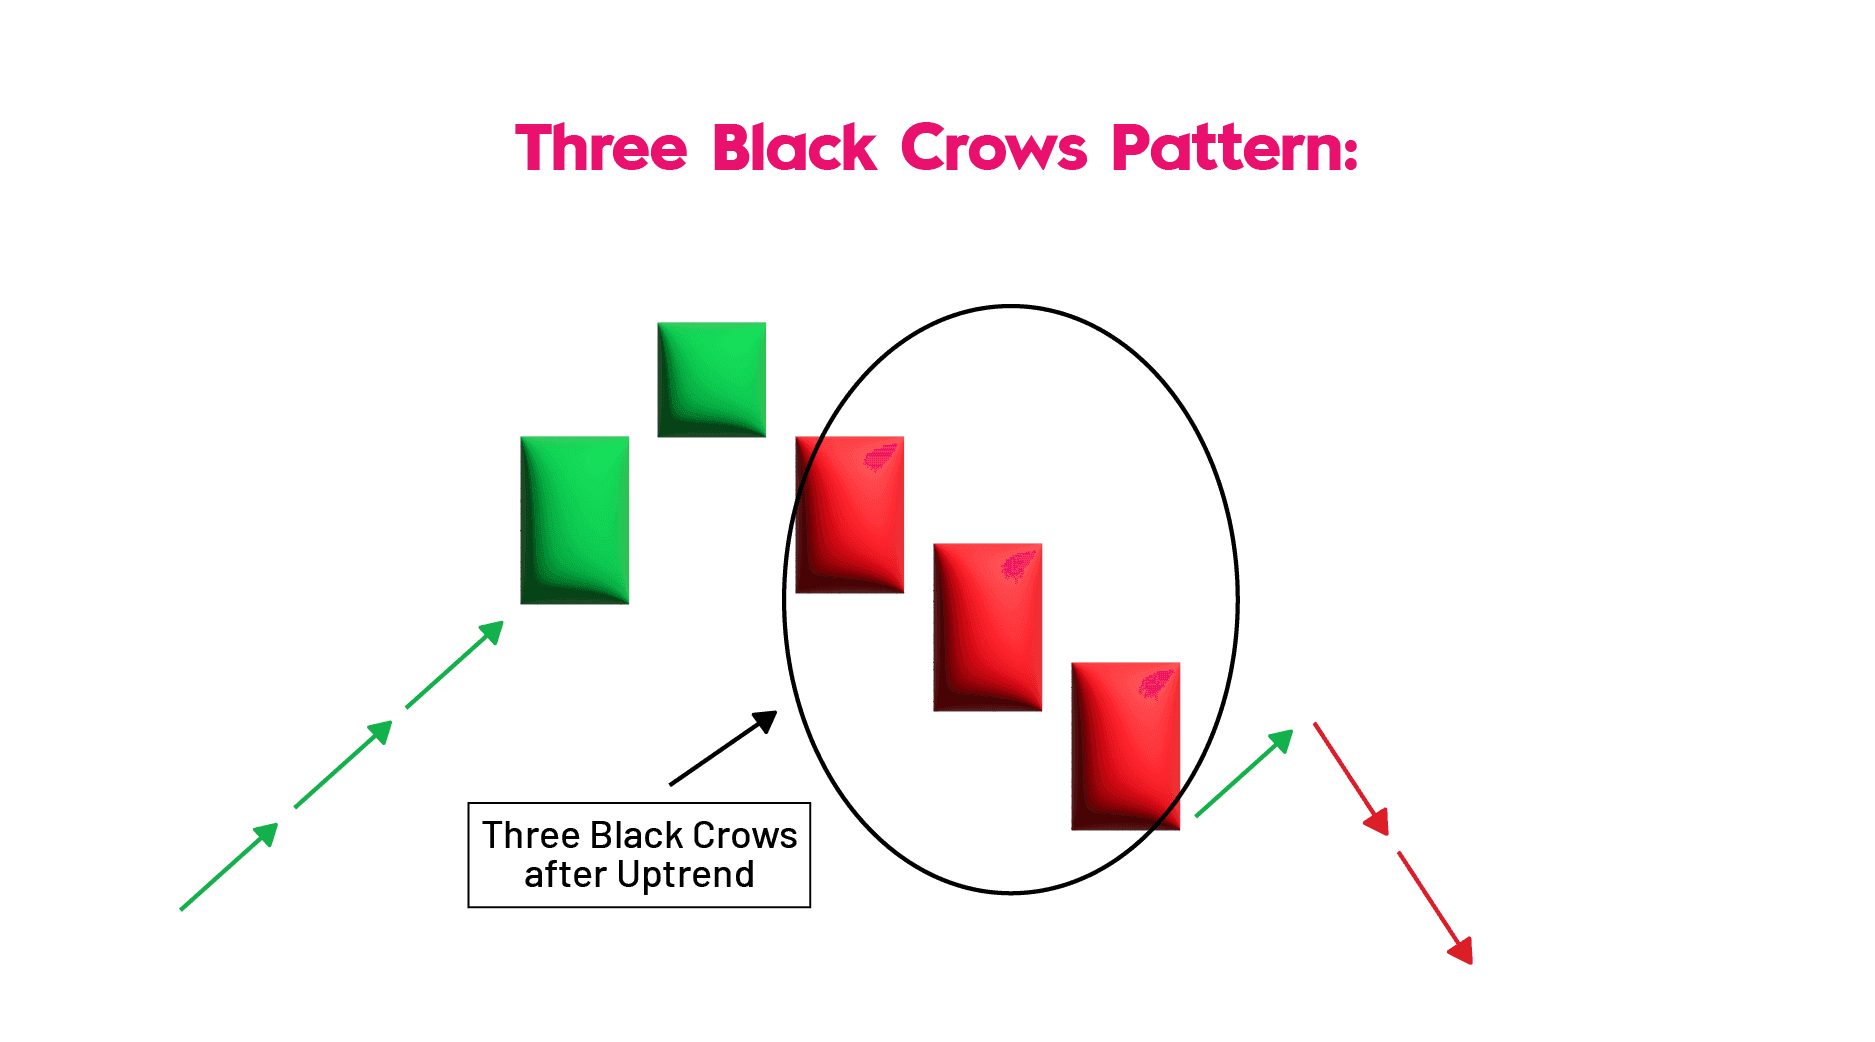
| Three Black Crows | Three consecutive long bearish candles signalling a reversal of an uptrend. | |
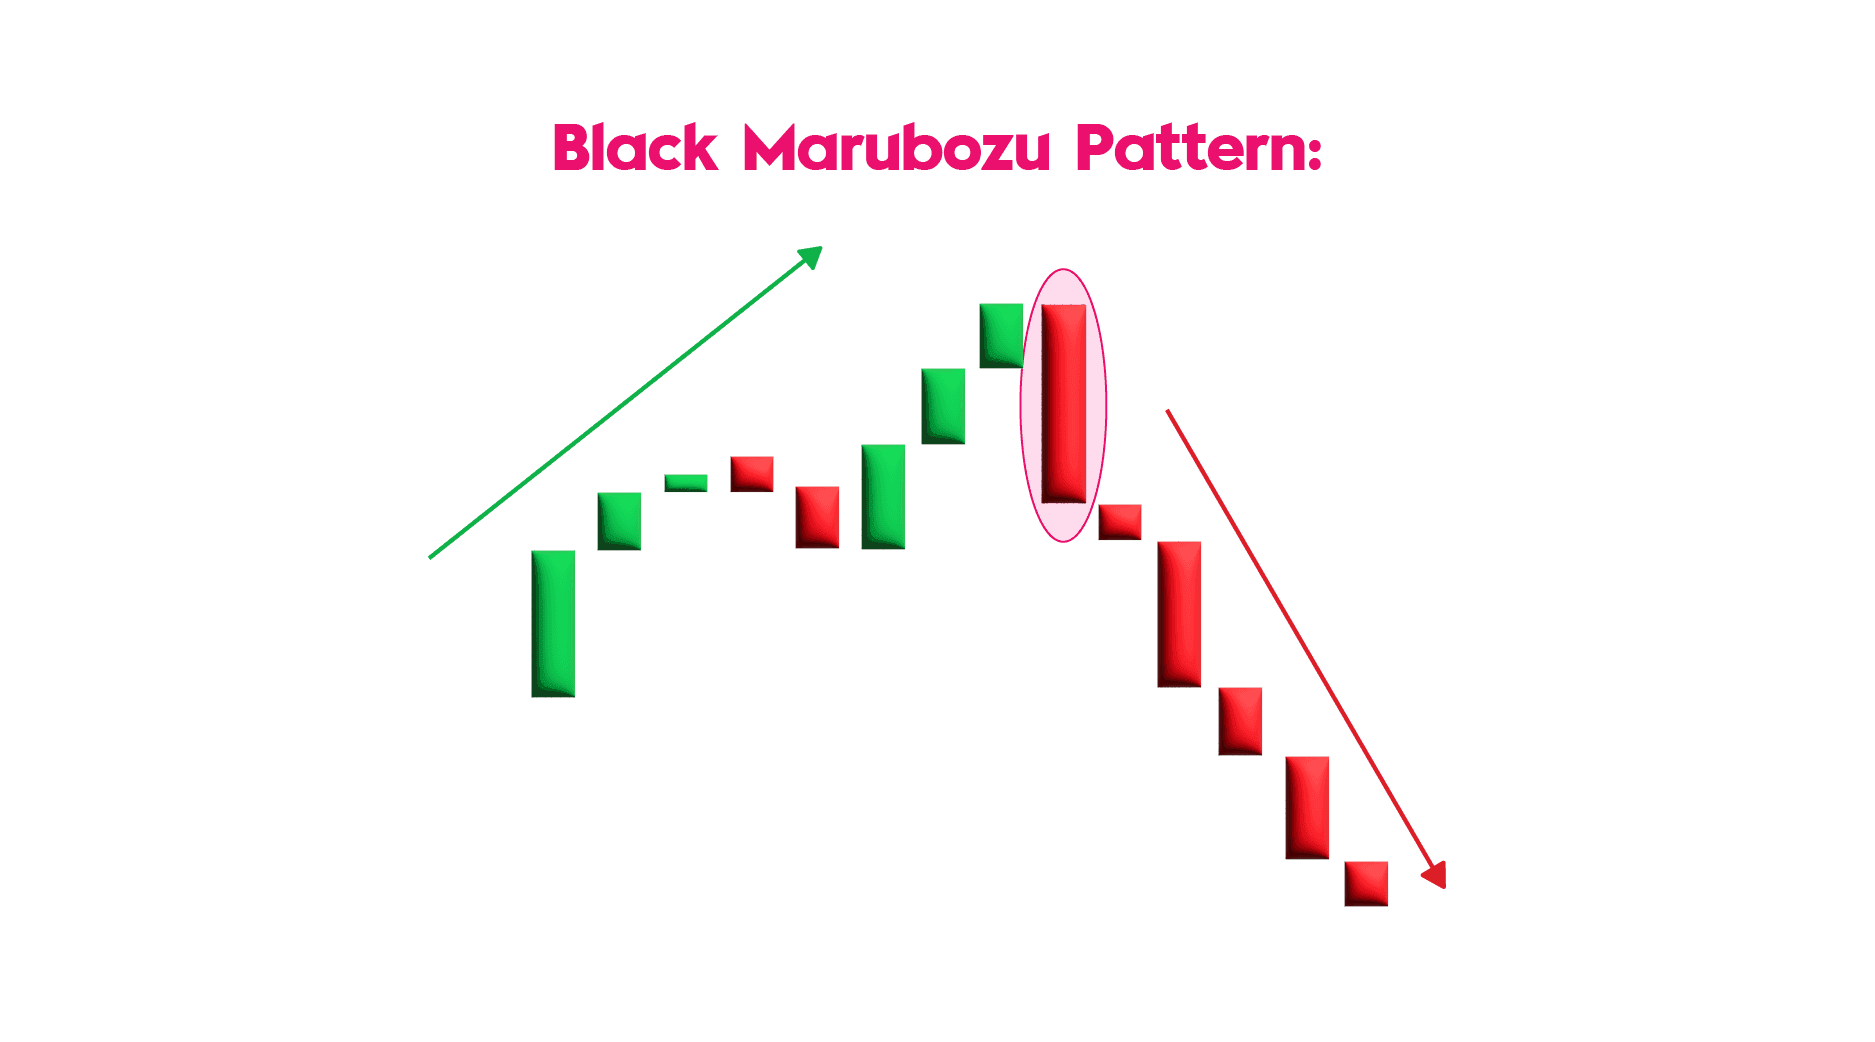
| Black Marubozu | A single long bearish candle with no shadows, indicating strong selling pressure and potential reversal. | |
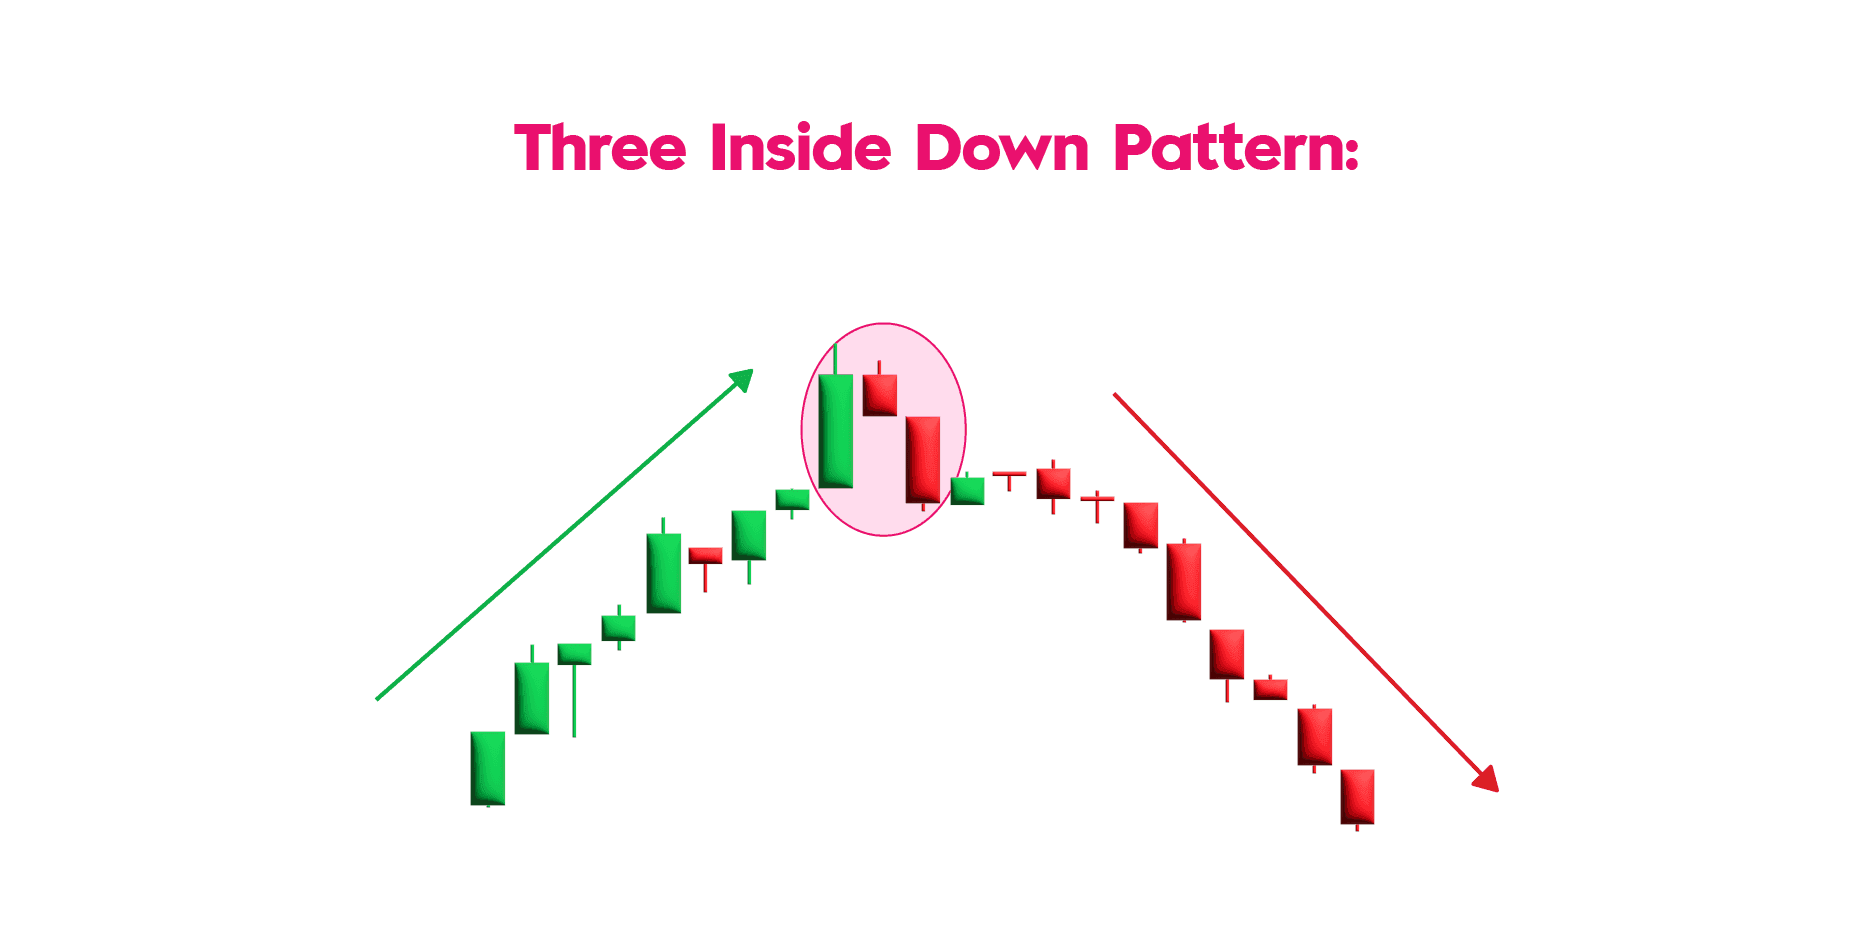
| Three Inside Down | Three candles: long bullish first, small bearish second within the first, and a long bearish third confirming reversal. | |
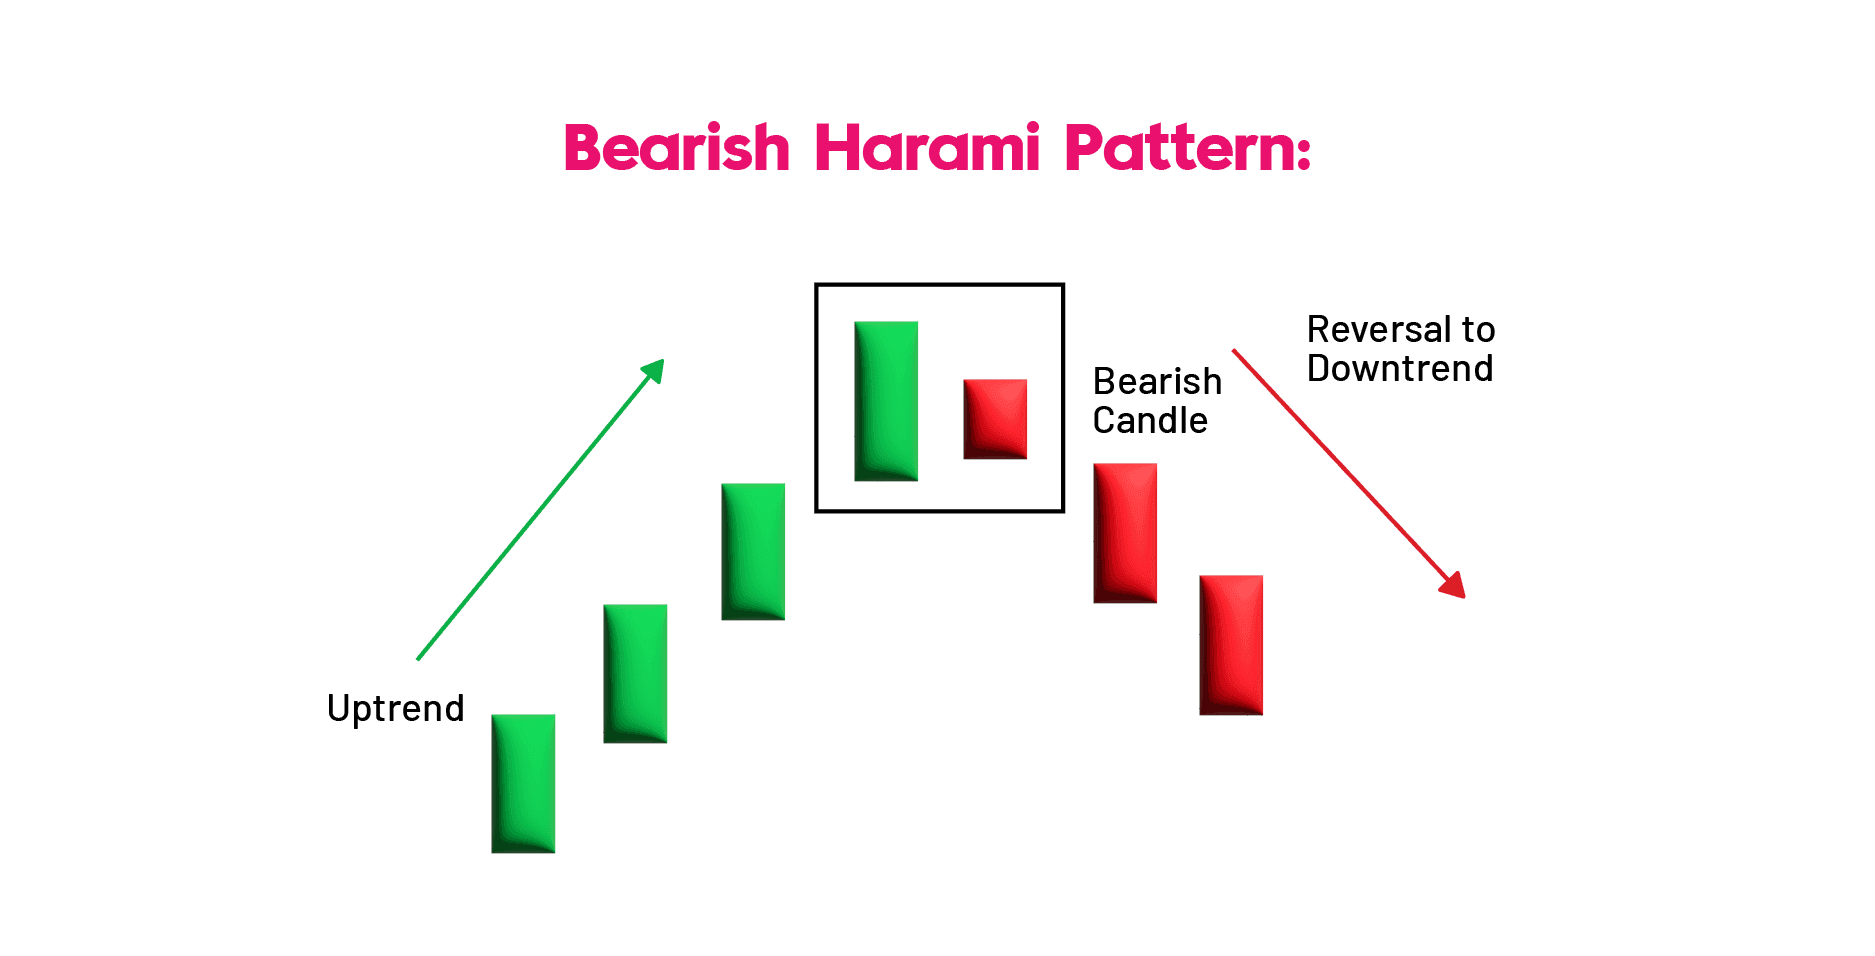
| Bearish Harami | Two candles where the first bullish candle is followed by a smaller bearish candle within the range of the first, signalling a reversal. | |
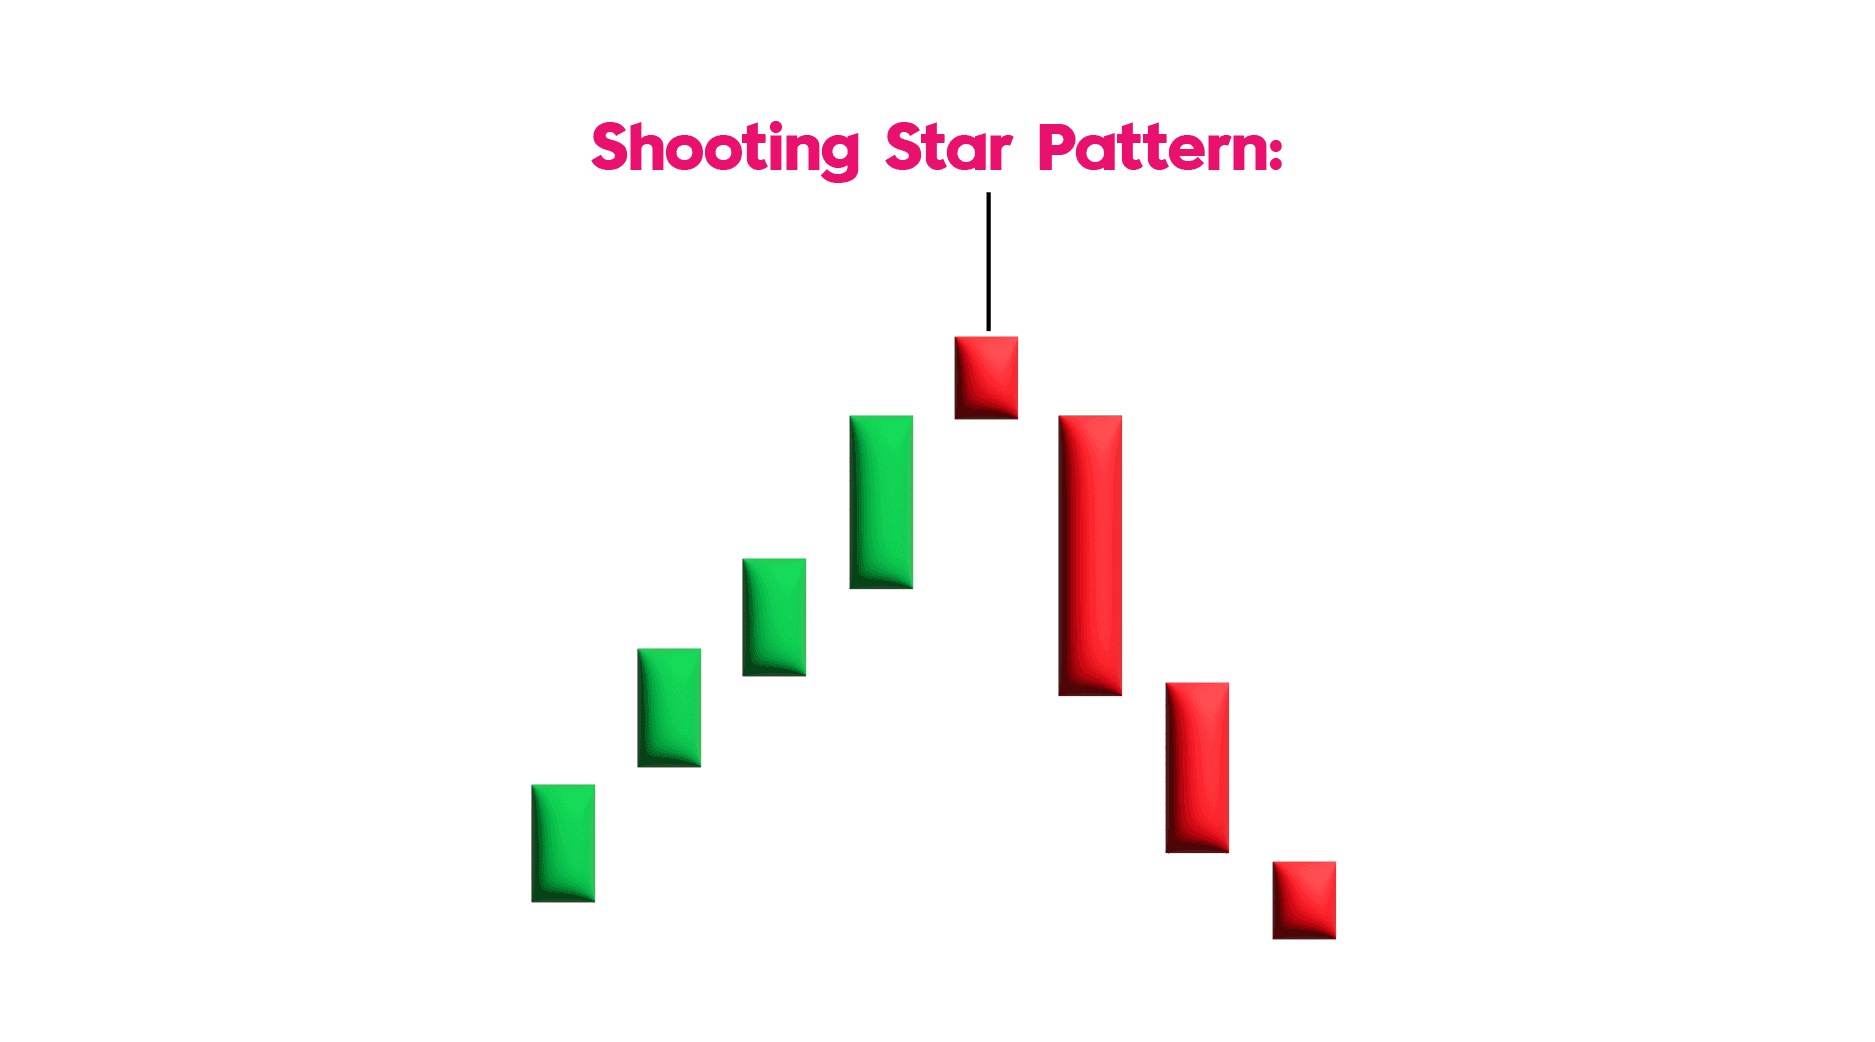
| Shooting Star | Forms at the end of an uptrend with a small body and long upper wick, indicating a bearish reversal. | |
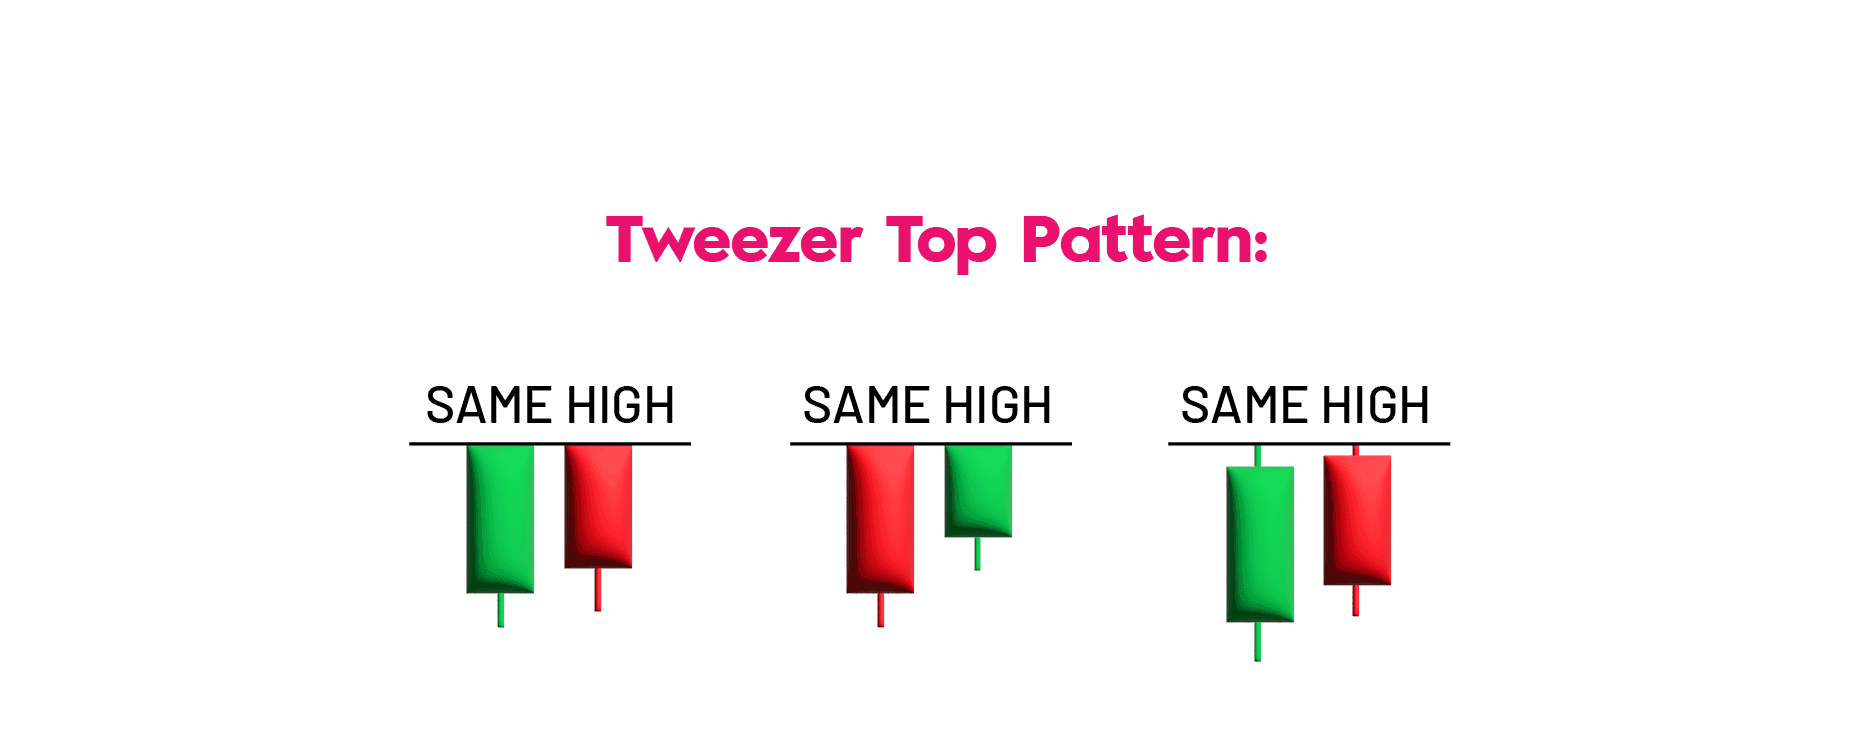
| Tweezer Top | Two candles with equal tops, signalling a reversal of an uptrend. | |
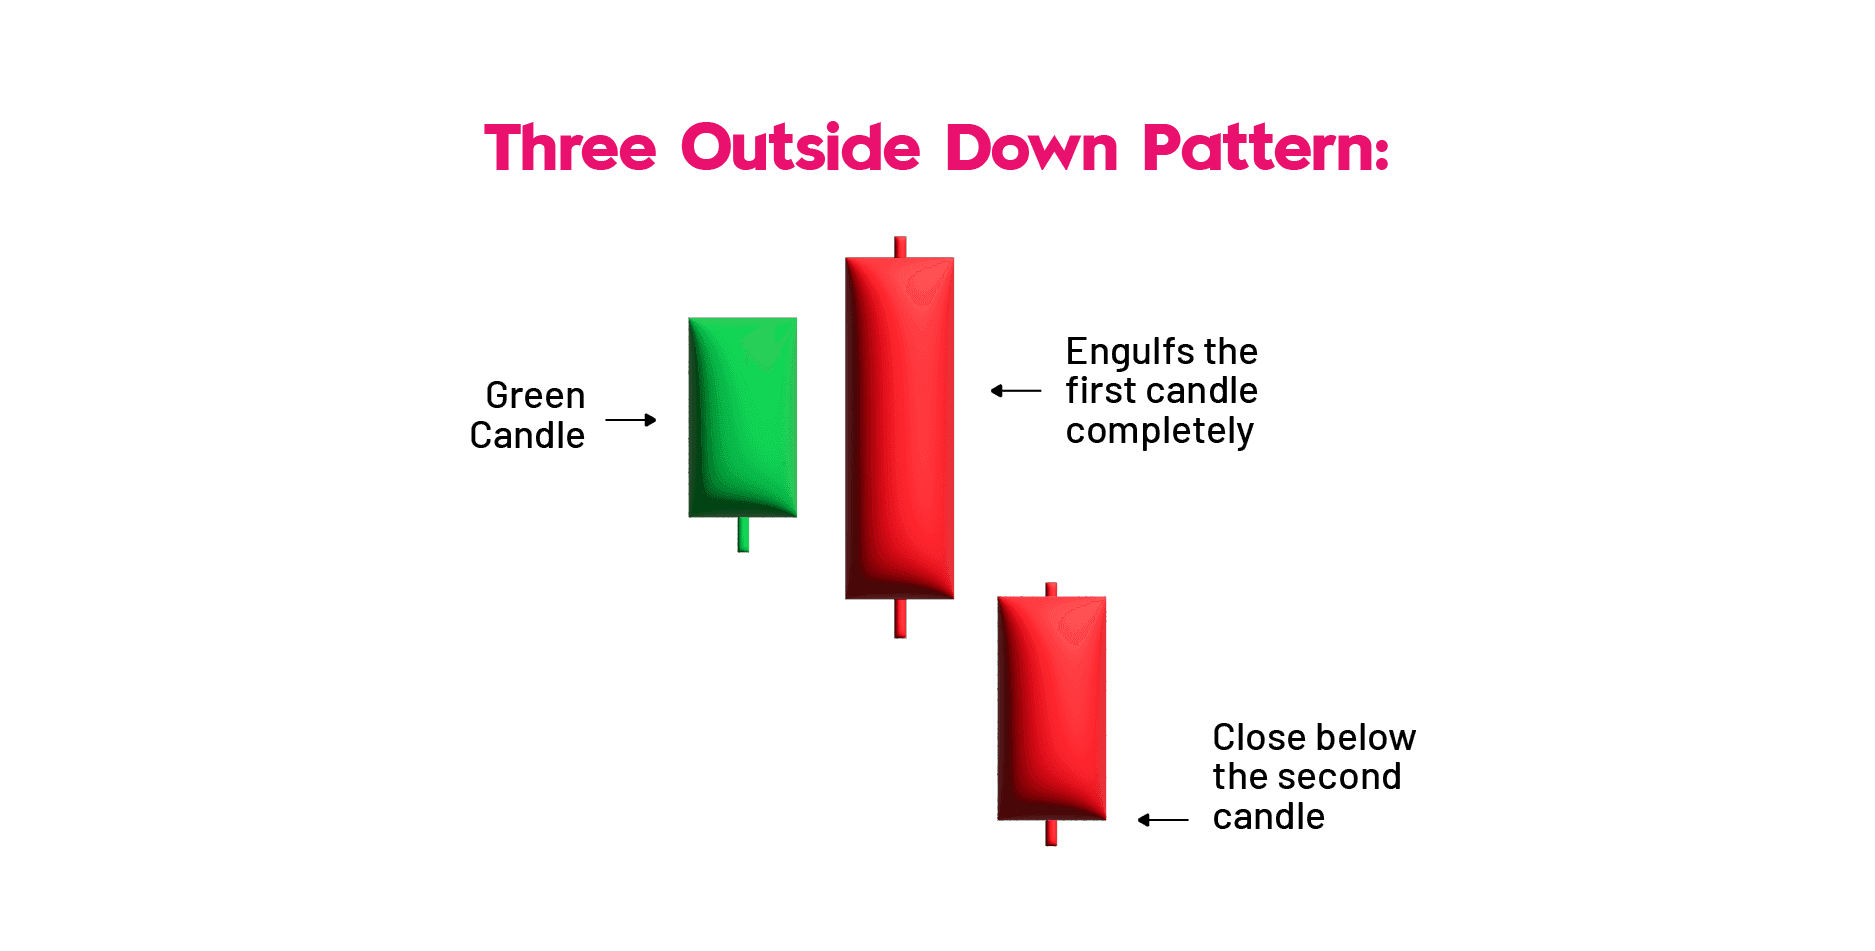
| Three Outside Down | Three candles: short bullish first, large bearish second engulfing the first, and a third confirming bearish reversal. | |
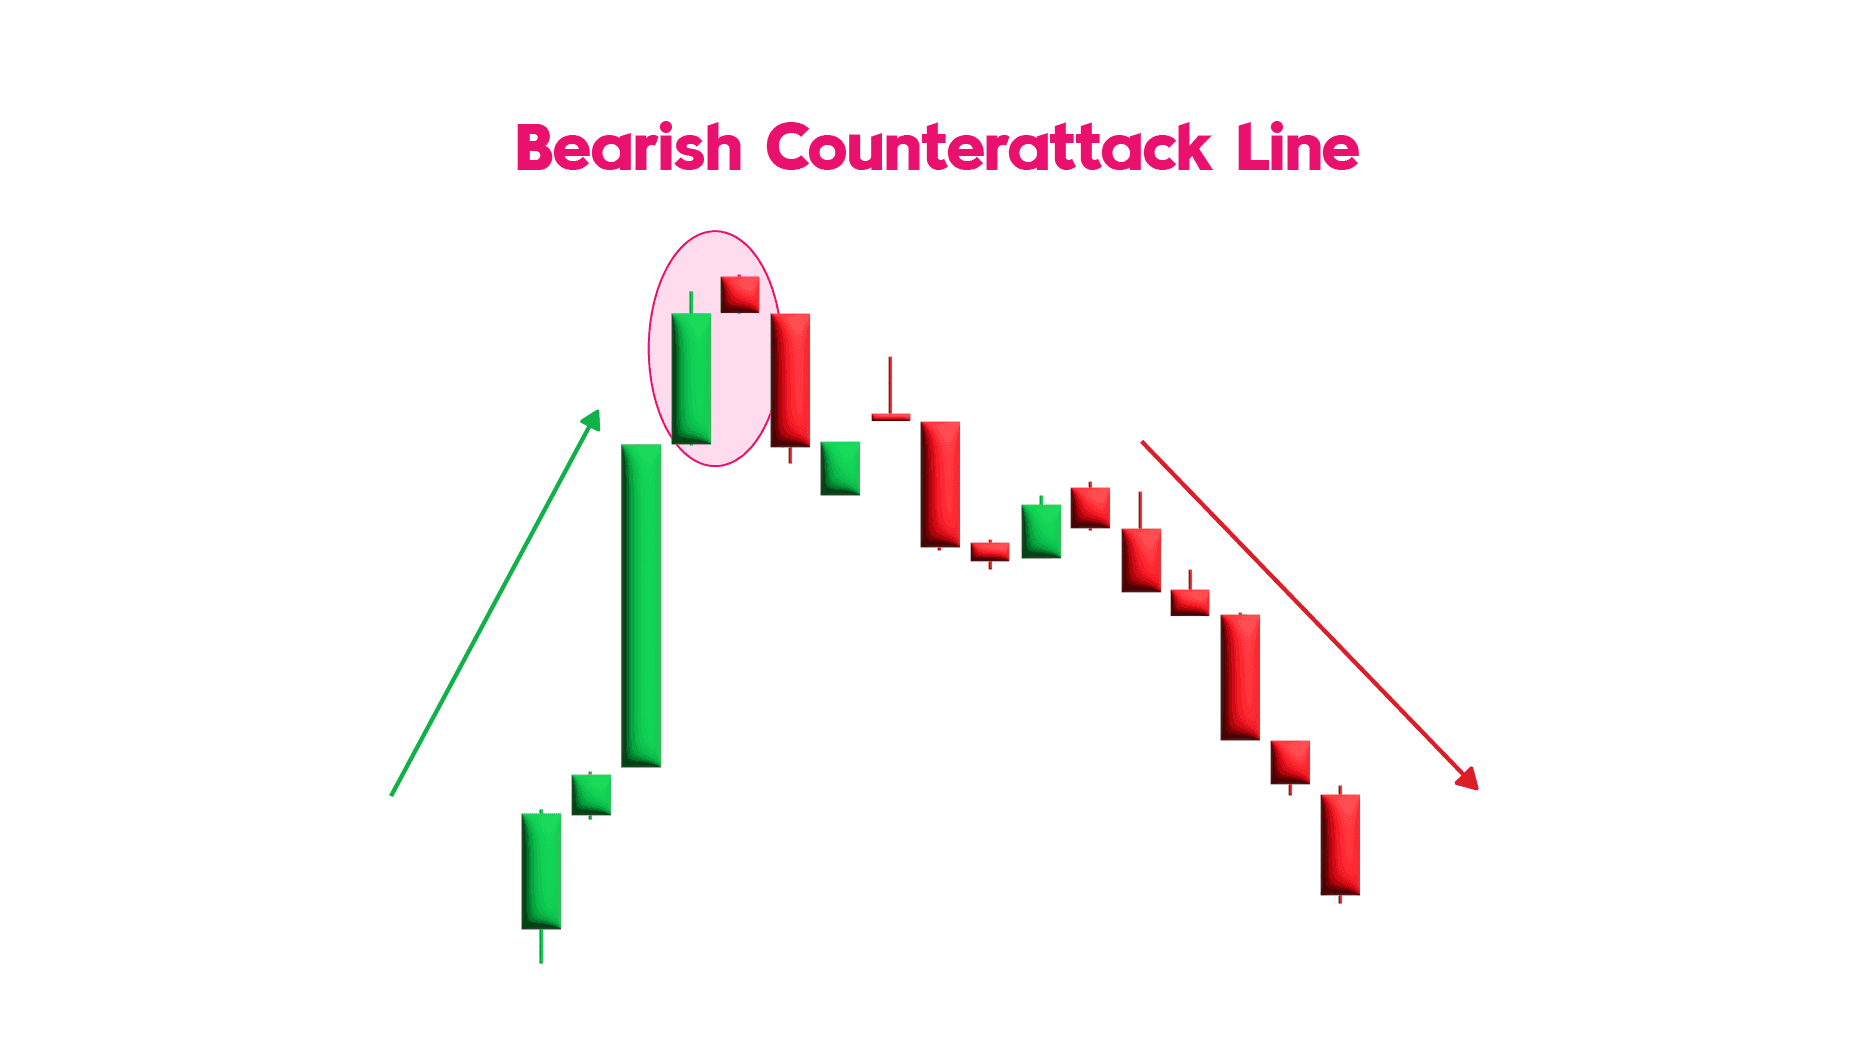
| Bearish Counterattack | Two-candle pattern predicting a reversal in an uptrend, with the second bearish candle closing below the first bullish candle's close. | |
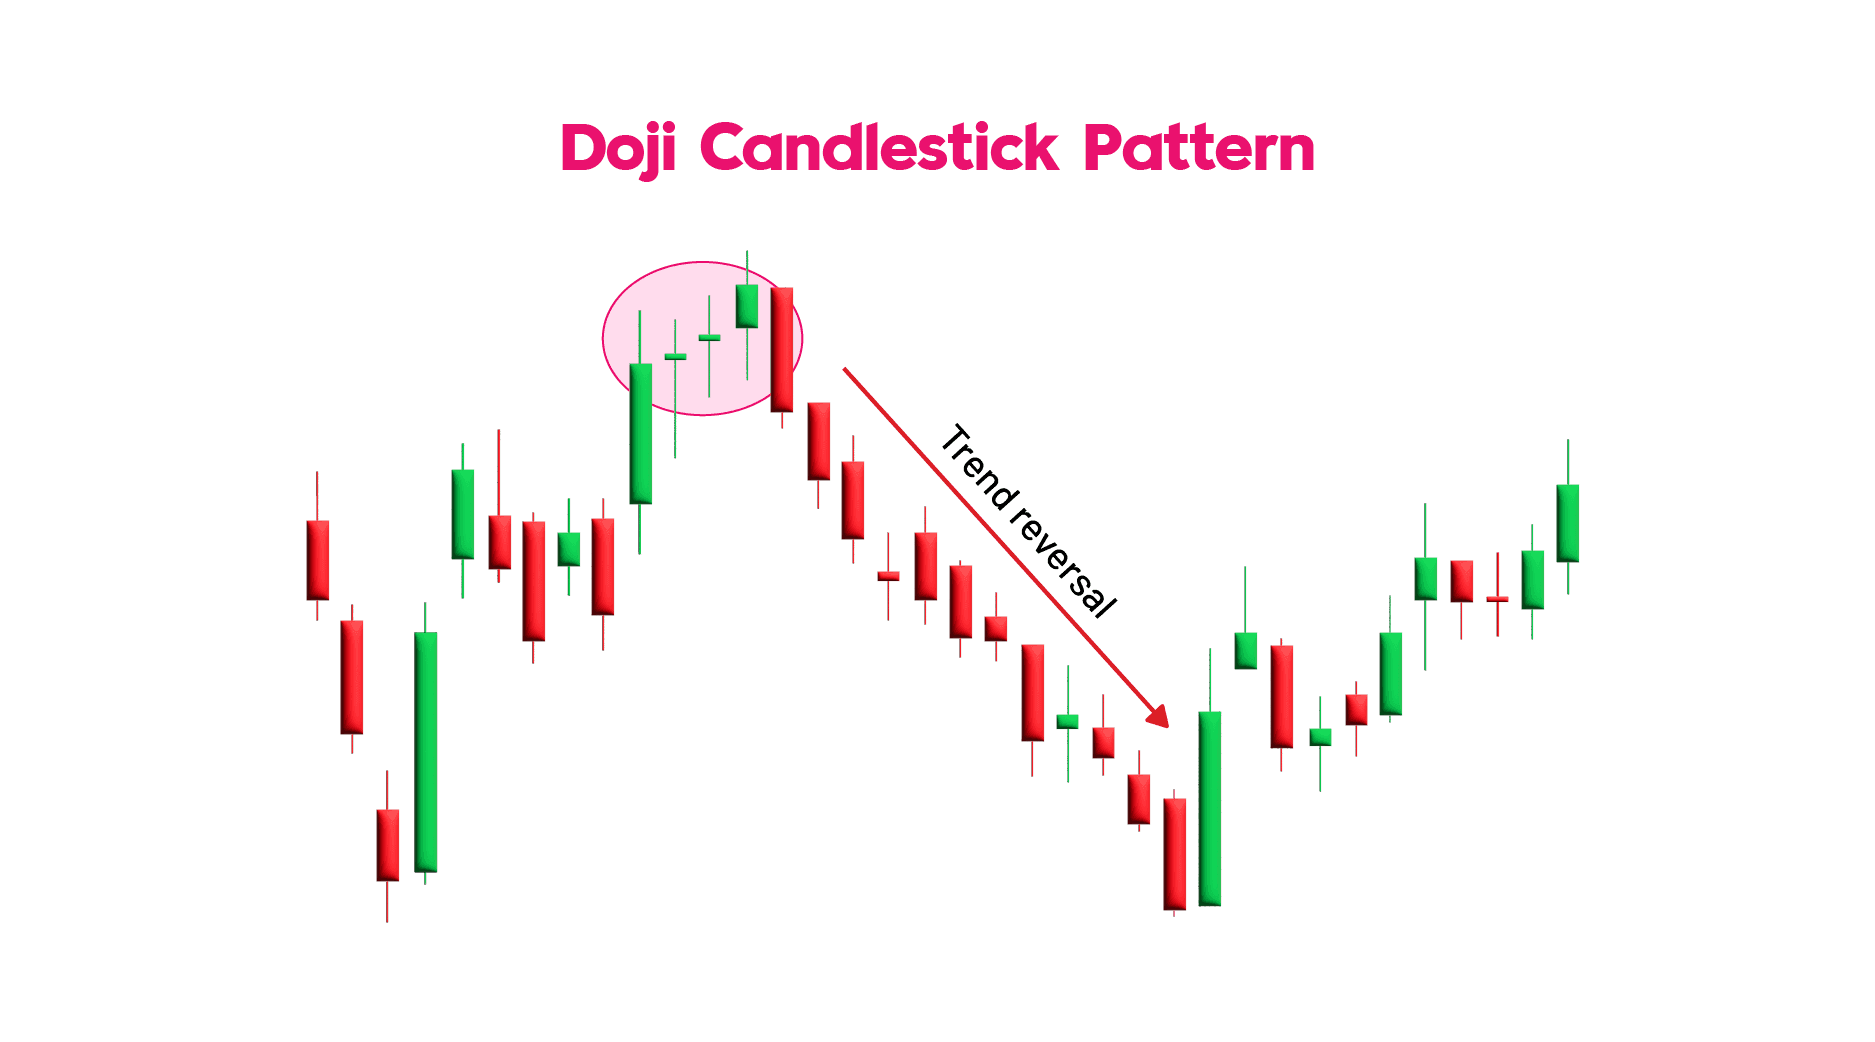
| Continuation Pattern | Doji | Indicates indecision with opening and closing prices almost equal, showing market uncertainty. |
| Spinning Top | Similar to Doji but with a larger body, indicating market indecisiveness. | |
| Falling Three Methods | Five-candle bearish continuation pattern with two long bearish candles and three short bullish candles in between. | |
| Rising Three Methods | Five-candle bullish continuation pattern with two long bullish candles and three short bearish candles in between. | |
| Upside Tasuki Gap | Three-candle bullish continuation pattern with two long bullish candles and a gap up between them. | |
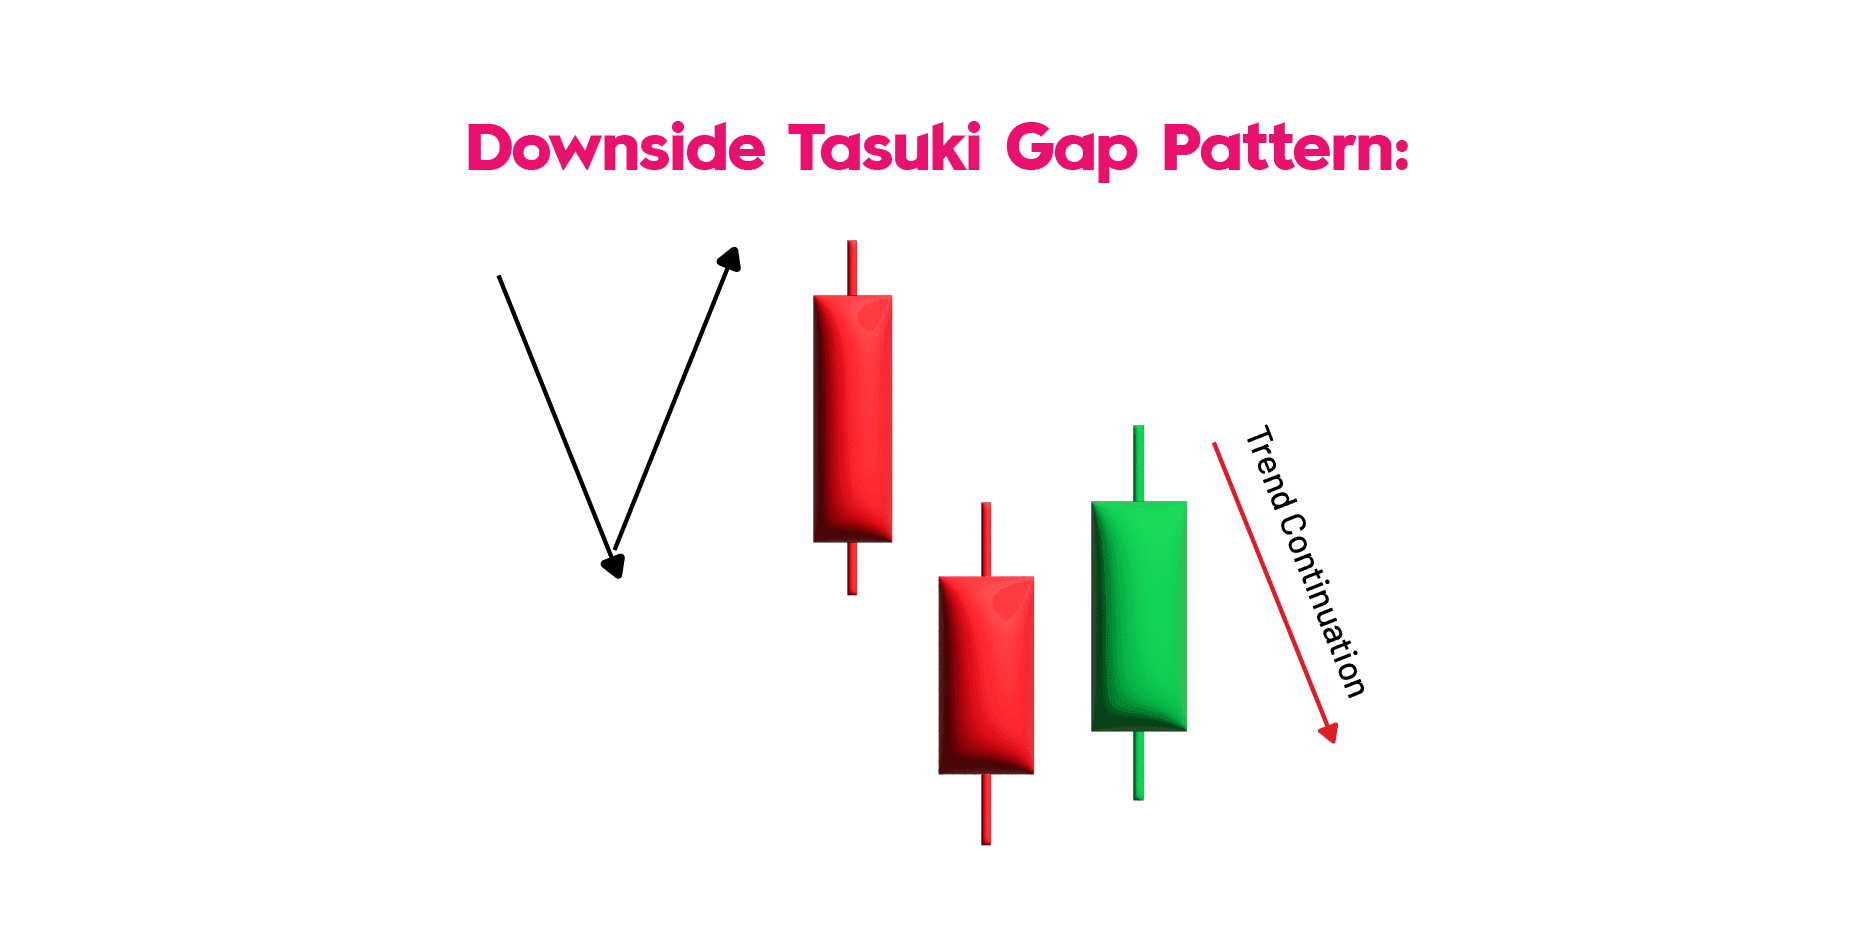
| Downside Tasuki Gap | Three-candle bearish continuation pattern with two long bearish candles and a gap down between them. | |
| Mat Hold | Continuation pattern with a large bullish/bearish candle, followed by smaller candles countering the trend, then a large candle resuming the trend. | |
| Rising Window | Two bullish candles with a gap between them, indicating strong buyer momentum. | |
| Falling Window | Two bearish candles with a gap between them, indicating strong seller momentum. | |
| High Wave | Indecision pattern with long upper and lower wicks and small bodies, indicating market uncertainty. |
Candlestick Pattern
These all are bullish candlestick patterns:
1. Hammer Candlestick Pattern
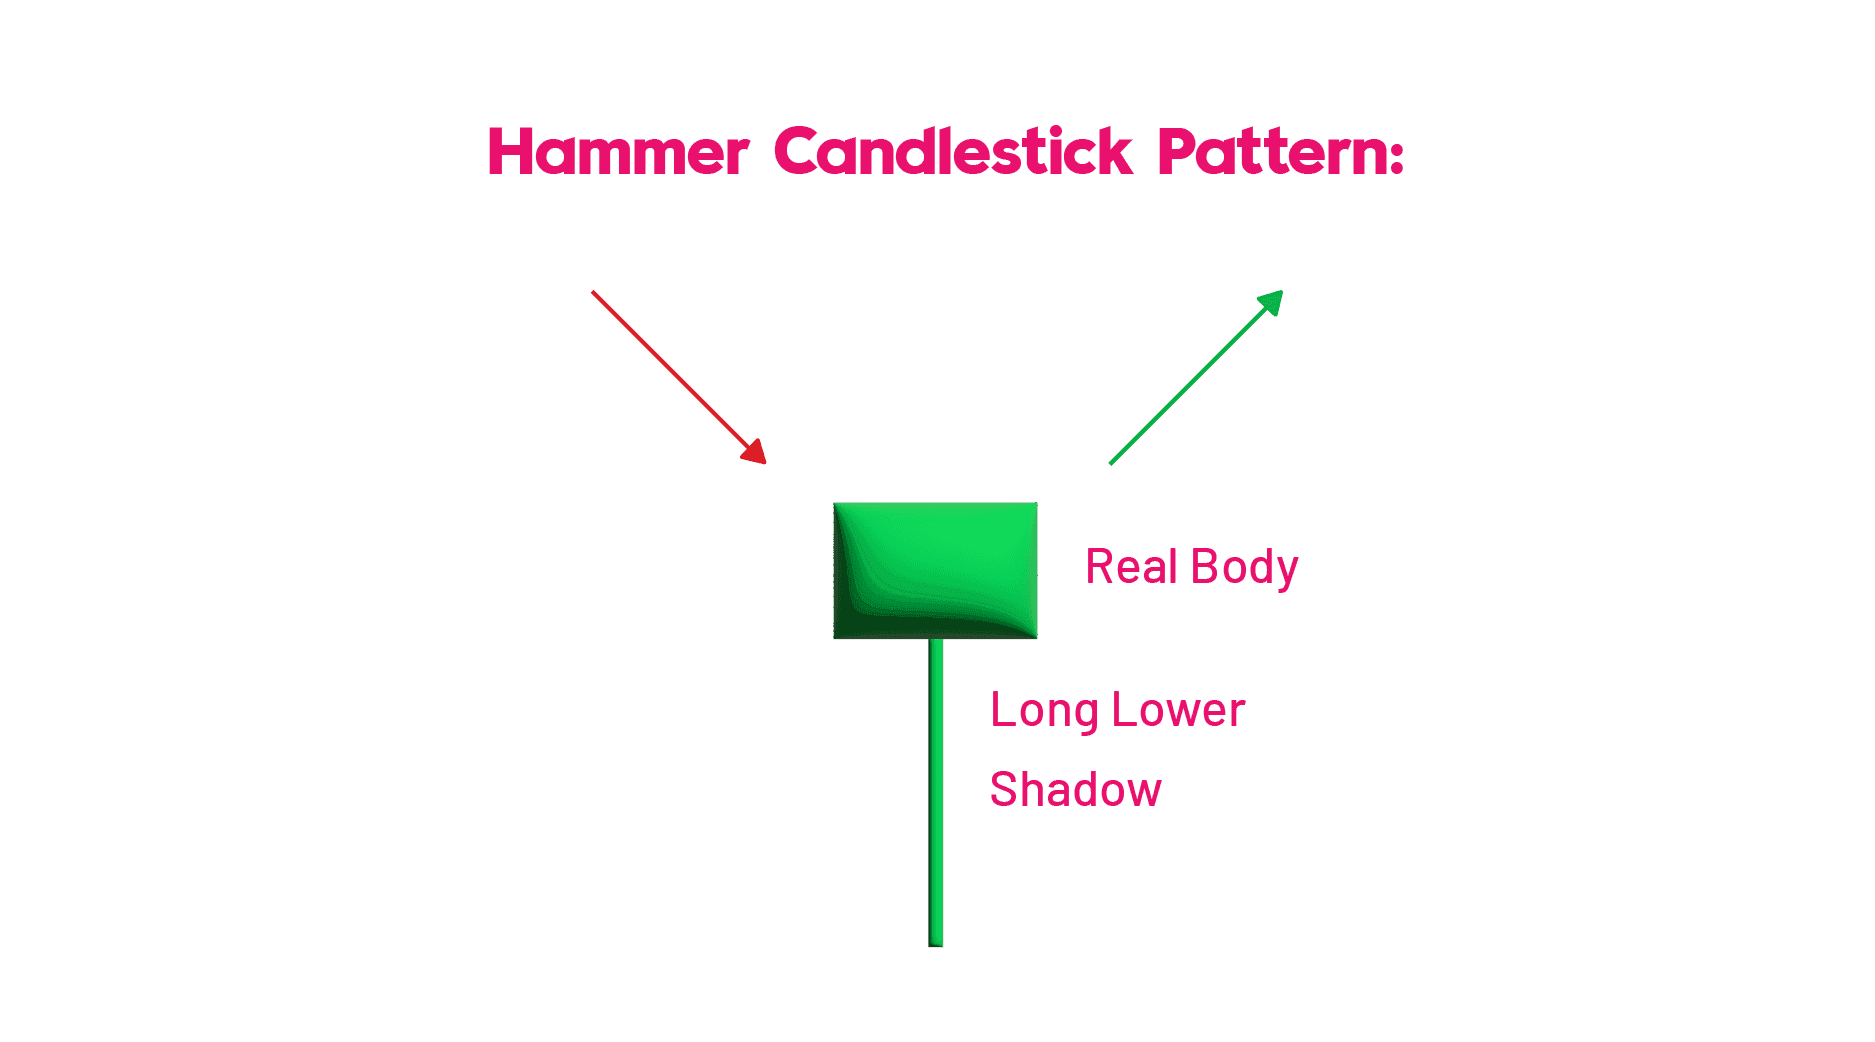
A Hammer candlestick pattern is a price formation in candlestick charts that occurs when a security trades significantly lower than its opening price but recovers to close near or above that opening level within the same period. This design is known as the Hammer candlestick pattern. It features a distinct hammer-shaped candlestick with a lower shadow at least twice the length of the real body.
The body represents the difference between the opening and closing prices, while the shadow illustrates the full trading range, including the highs and lows. The Hammer is one of the 35 powerful candlestick patterns that traders use to identify potential trend reversals and make informed decisions based on price action.
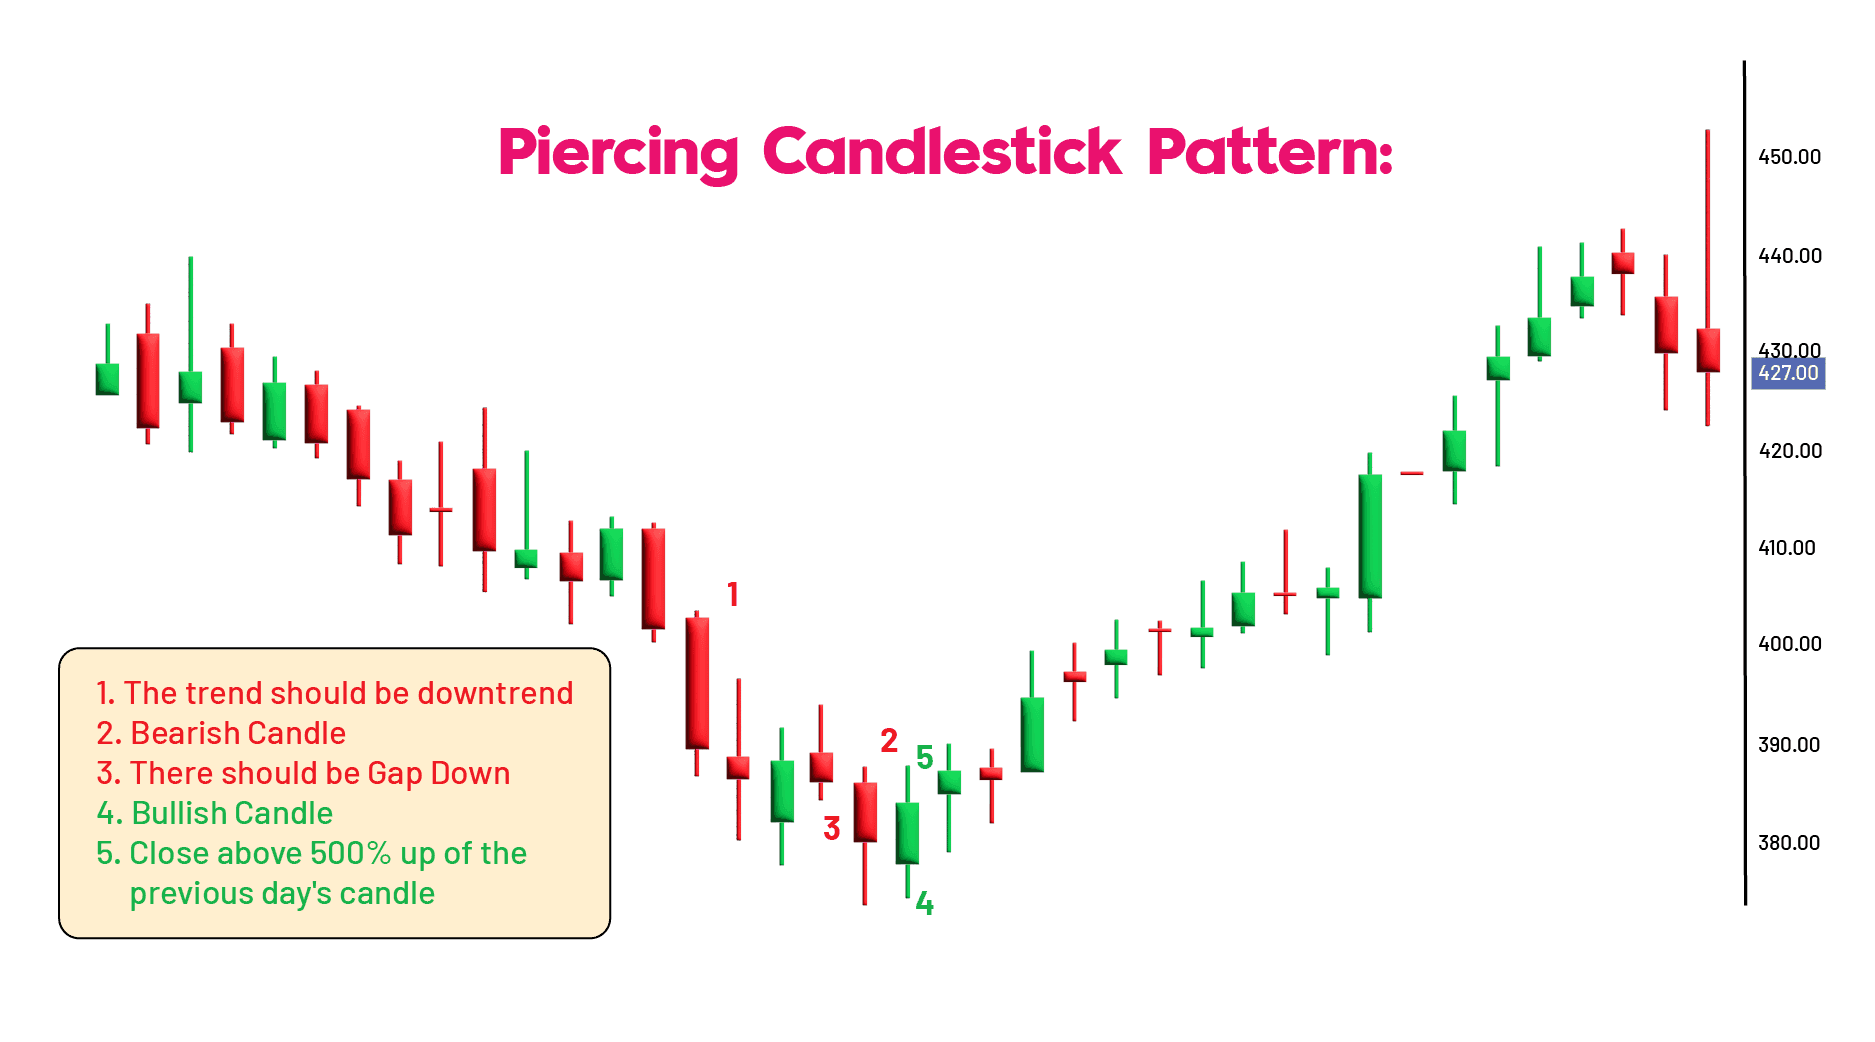
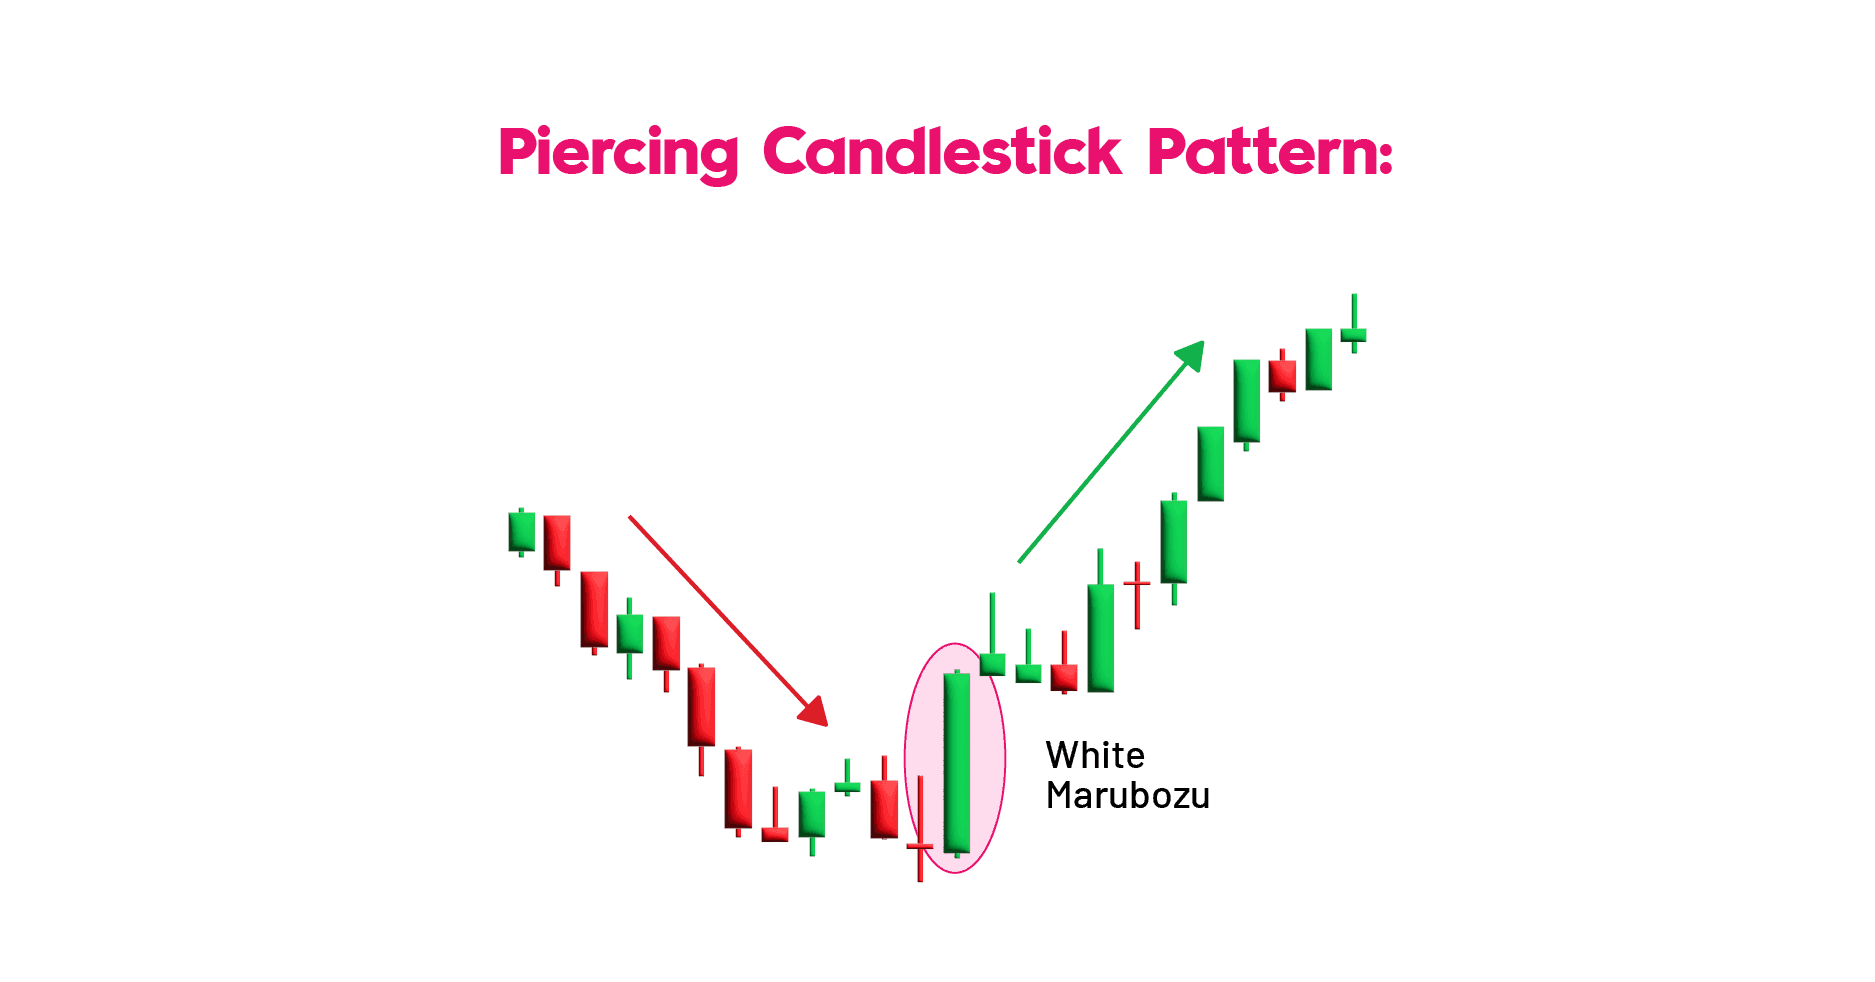
2. Piercing Candlestick Pattern
Piercing Patterns are several candlestick patterns that appear following a decline and indicate a bullish turnaround. It comprises two candles, the first of which is bearish and signals that the decline will continue. The second one is bullish. The second one reduces the gap but only covers more than half of the previous one's actual body. This indicates that the bulls are in the market, and a positive reversal is underway.
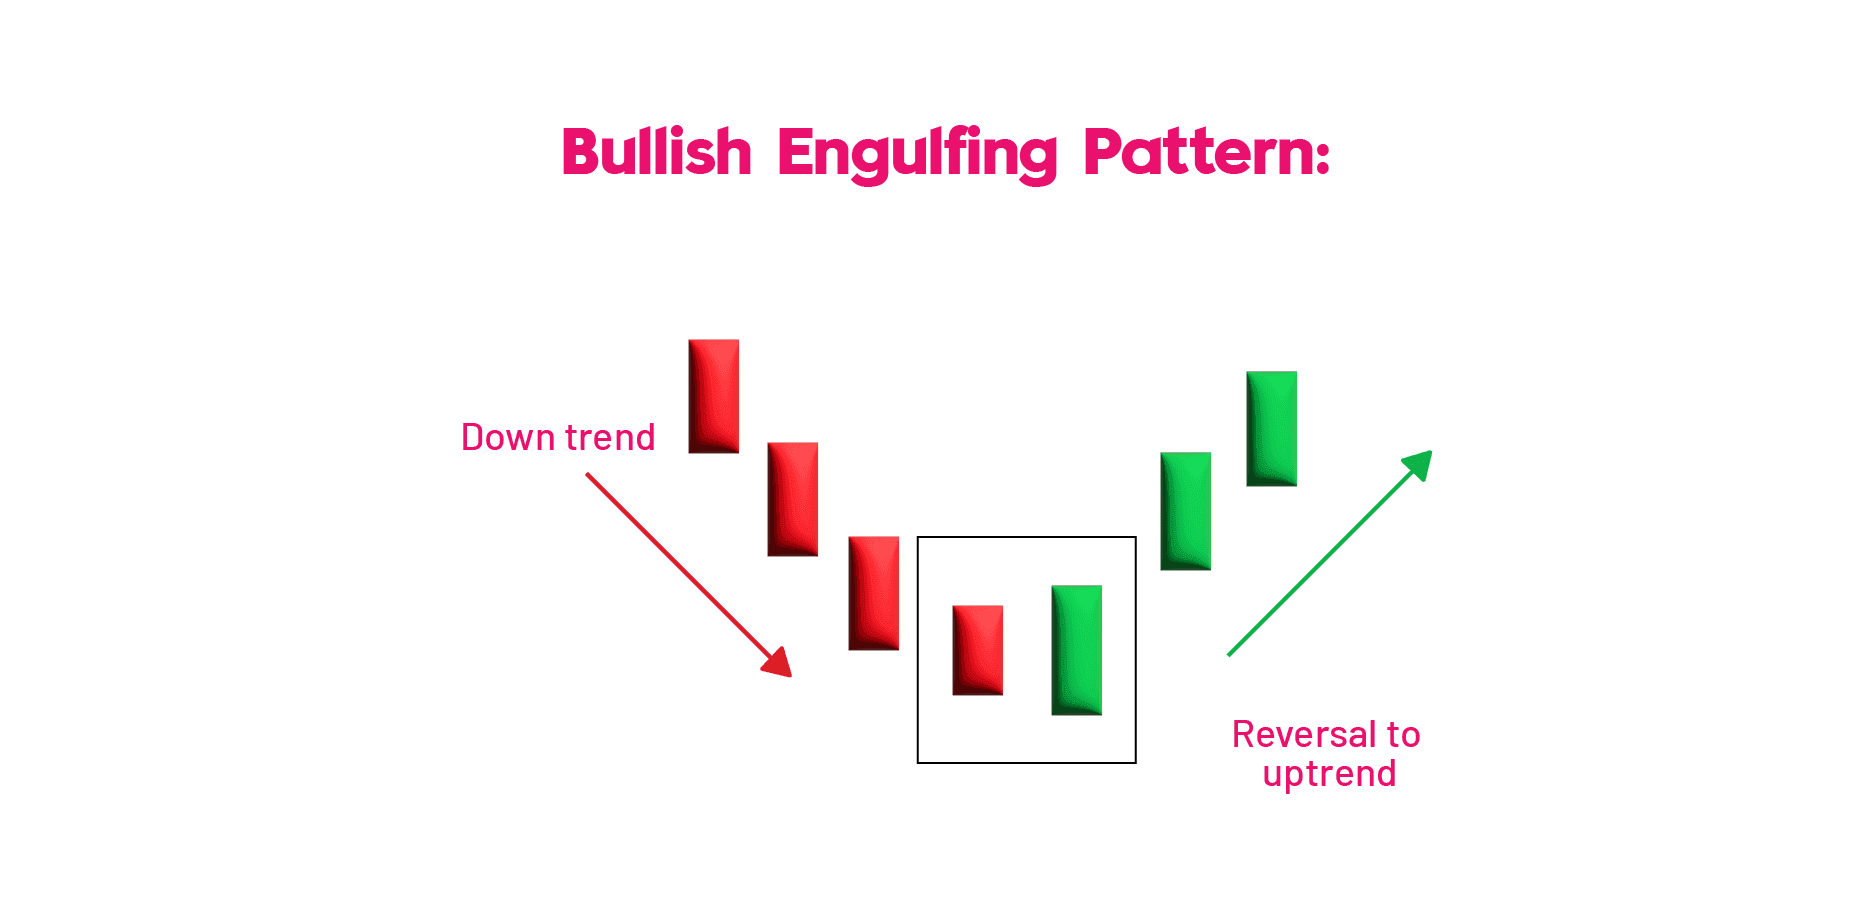
3. Bullish Engulfing Candlestick Pattern
The bullish engulfing candle comes at the bottom of a downtrend, indicating increased purchasing pressure. The bullish engulfing pattern frequently results in a trend reversal as additional buyers enter the market, driving prices upward. The pattern consists of two candles, with the second entirely swallowing the body of the preceding red candle.
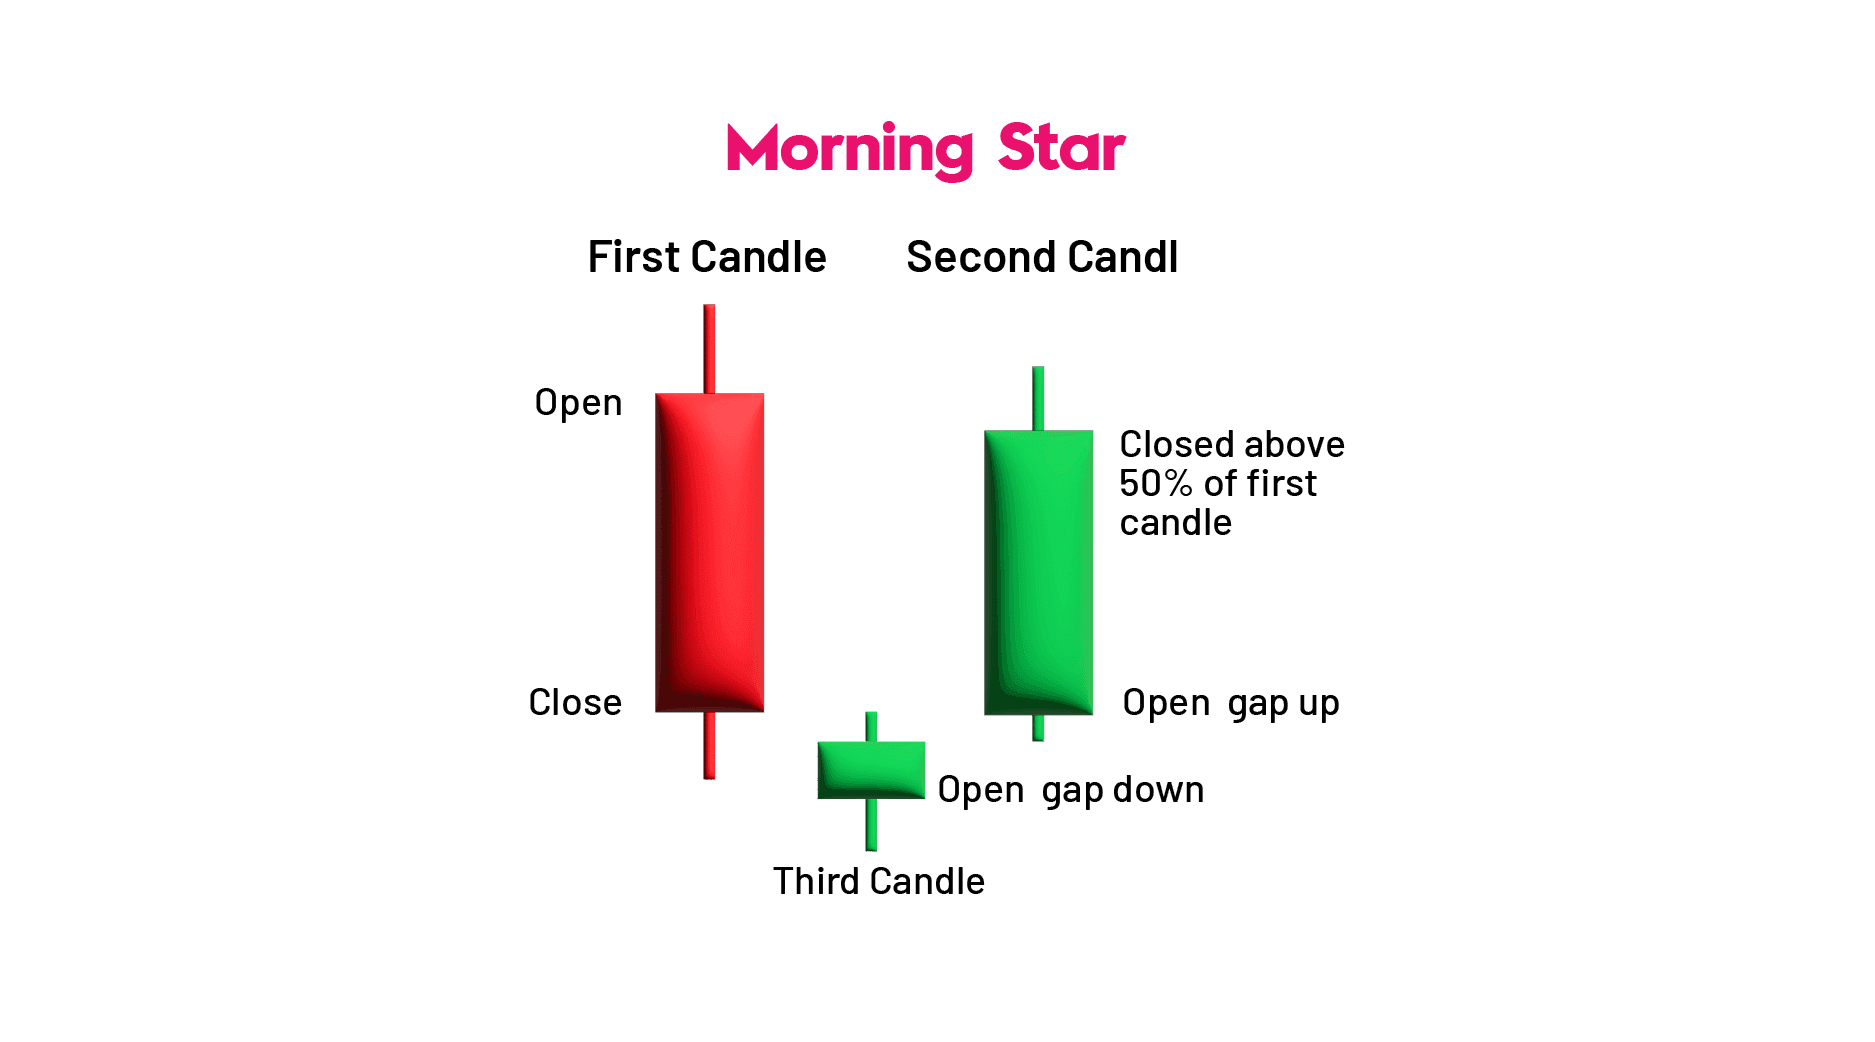
4. Morning Star Candlestick Pattern
The Morning Star pattern is another multiple candlestick chart that forms after a negative trend and signals a bullish turnaround. Made up of three candlesticks: the first is bearish, the second is a Doji, and the third is bullish. The first candle represents the continuance of a downward trend, while the second suggests market hesitation. The third bullish candle indicates that the bulls are poised to reverse the market. In this situation, the second candle must be fully separated from the true body of the first and third candles.
5. Three White Soldiers Candlestick Pattern
The three white soldiers pattern is a bullish candlestick formation on a trading chart that appears near the bottom of a downward trend. As the name implies, the design comprises three green candles. Because of the high purchasing demand, traders believe this pattern foreshadows impending price reversals. These candlestick patterns consist of three bullish bodies with no extended shadows that are open within the true body of the previous candle in the sequence.

6. White Marubozu Candlestick Pattern
The White Marubozu is a single candlestick pattern that forms after a decline and signals a bullish reversal. This candlestick has a lengthy bullish body and no upper or lower shadows, indicating that bulls are exerting purchasing pressure and the markets may turn bullish. This single-stick pattern is generated during a negative trend and suggests a bullish reversal.
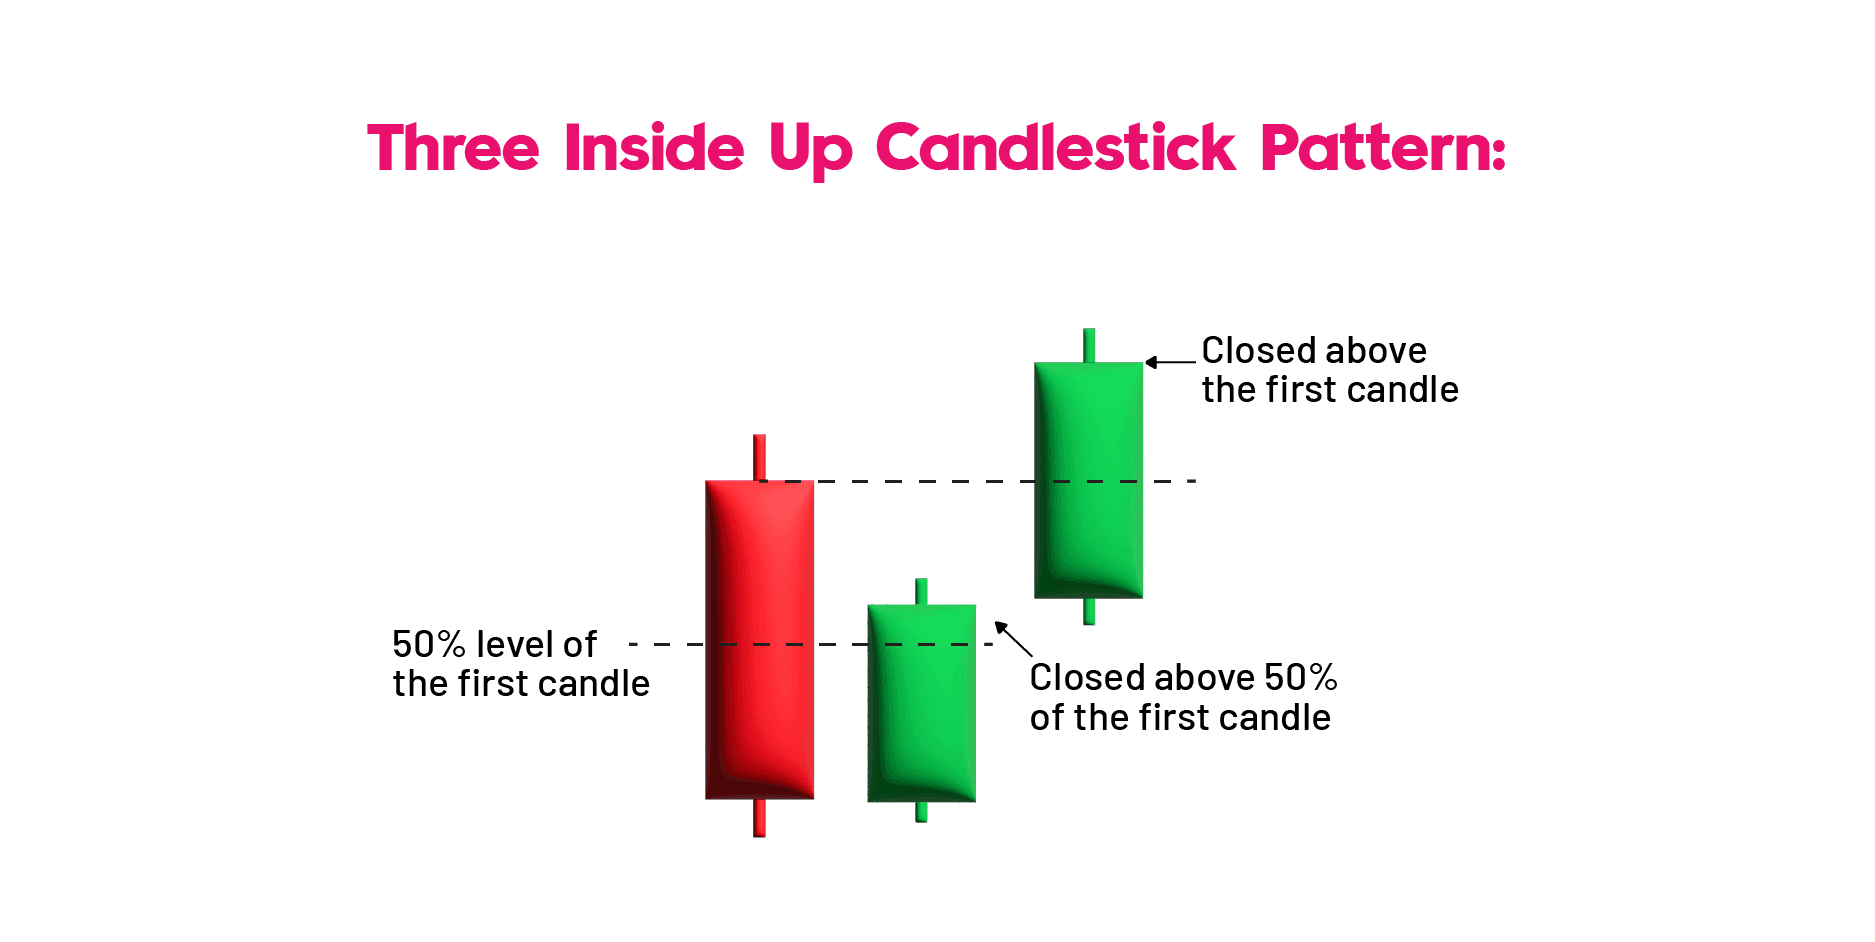
7. Three-Inside-Up Candlestick Pattern:
The three insides up is a multi-candlestick pattern that emerges after a downward trend. It consists of three candlesticks: the first is a bearish candle, the second is a modest bullish candle inside the range of the first, and the third is a lengthy bullish candle that confirms the bullish reversal. The connection between the first and second candlesticks should follow the bullish Harami candlestick pattern. Traders might take a long trade after this candlestick pattern is completed.
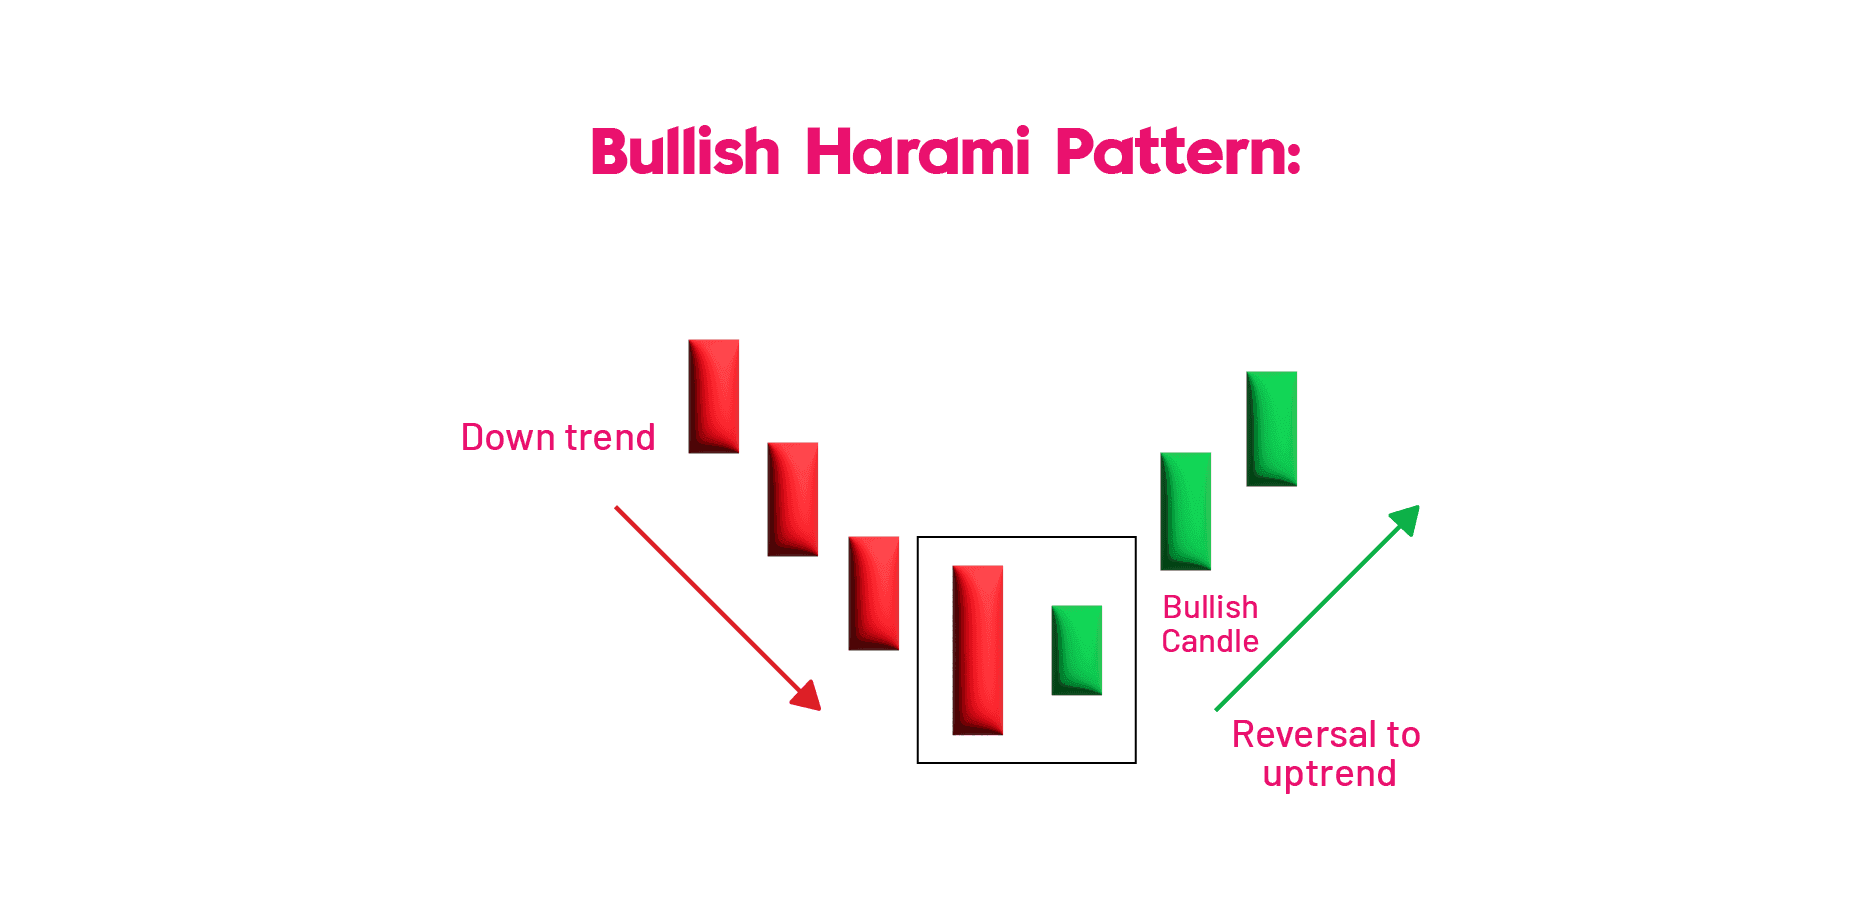
8. Bullish Harami Candlestick Pattern:
The Bullish Harami is a multiple candlestick chart pattern developed after a downturn and indicates a bullish turnaround. It comprises two candlestick charts, the first a towering bearish candle and the second a little bullish candle that should be inside the first candlestick's range. The first negative candle represents the continuance of the bearish trend, while the second candle indicates that bulls have returned to the market. This multi-candle chart pattern consists of two candlesticks: the first is a towering bearish candlestick, and the second is a little bullish candlestick that is within range of the first. The first candlestick represents a continuation of the negative trend, whilst the second indicates that bulls have returned to the market.
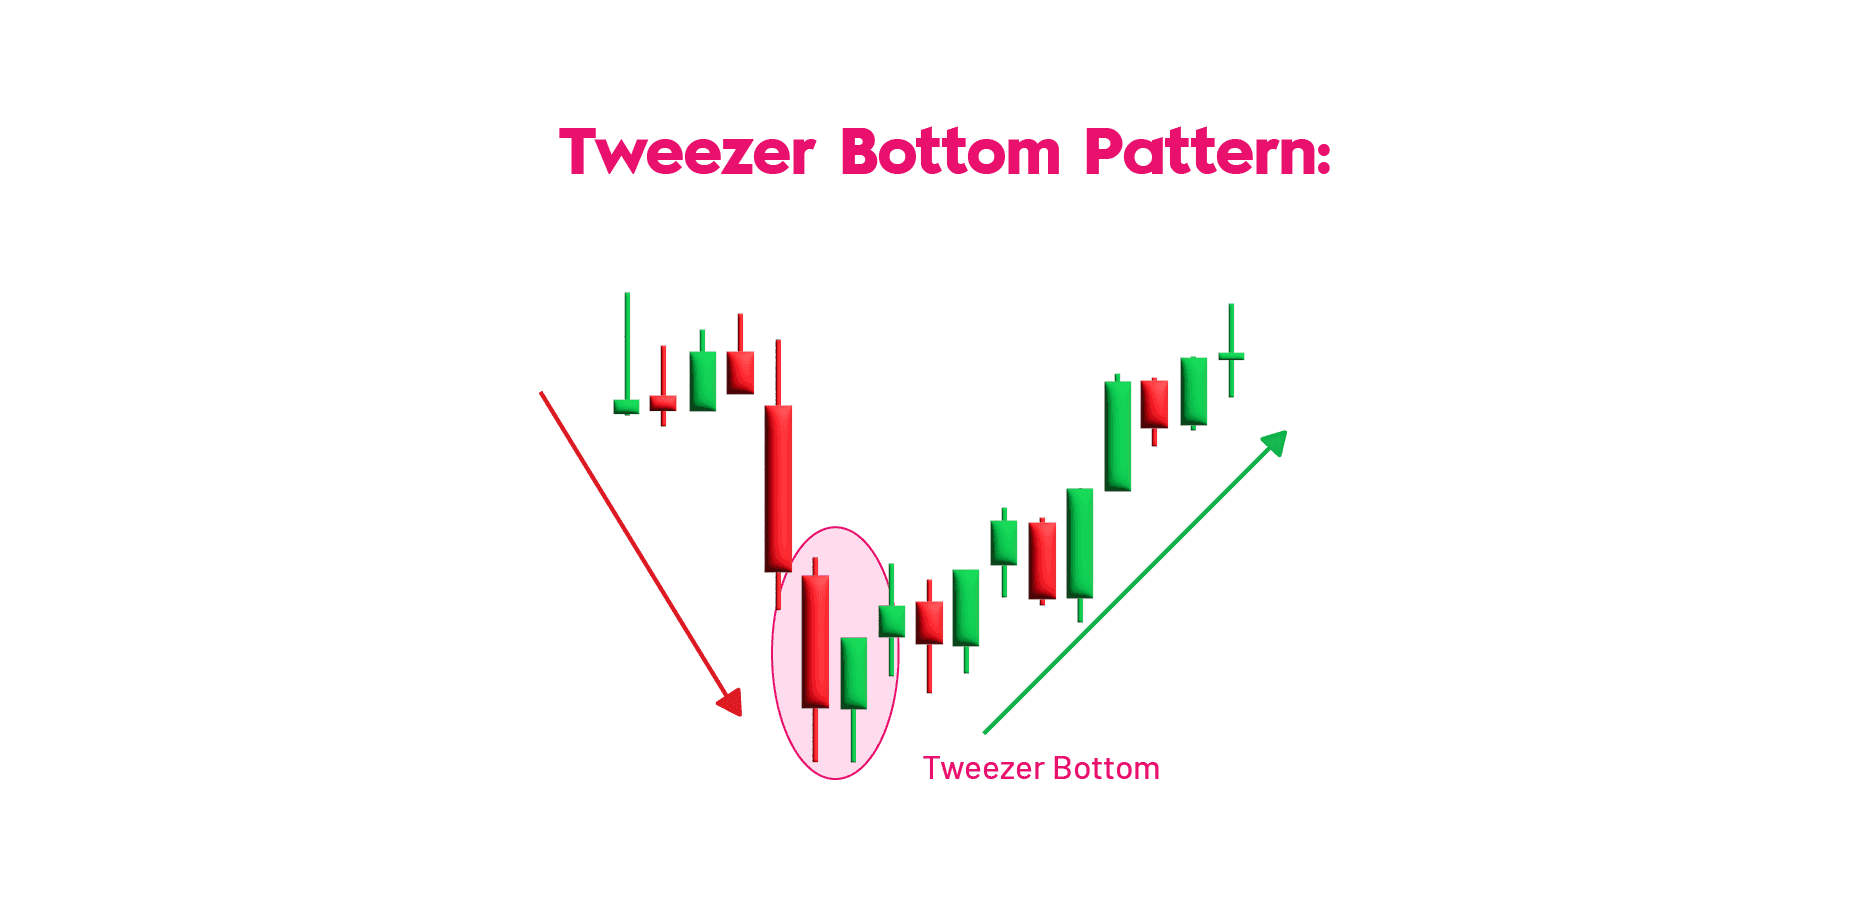
9. Tweezer Bottom Candlestick Pattern:
A tweezer bottom pattern occurs when two candlesticks establish two identical support levels, resulting in a reversal in a downtrend. This pattern might appear during a turning point or a stock reversal. It enables precision trading and dip buying situations. Tweezer bottoms are generally seen during a stock's downturn. Once a tweezer bottom is established, traders should watch for a reversal for the price to rise. Before initiating a trade, confirm with further indications and develop an entry, exit, and stop-loss strategy. A game plan enables traders to stay in a transaction and regulate their emotions.
10. Inverted Hammer Candlestick Pattern
The inverted hammer candlestick pattern (the inverse hammer) emerges on a chart when buyers exert pressure to drive an asset's price upward. It frequently appears near the bottom of a downtrend, indicating a possible bullish reversal. The inverted hammer pattern derives its name from its form, which resembles an upside-down hammer. To recognise an inverted hammer candle, look for a large top wick, a short lower wick, and a tiny body.
11. Three Outside Up Candlestick Pattern
The Three Outside Up pattern is a bullish trend reversal with three candles. A bearish candlestick pattern is followed by a bullish candlestick pattern that begins below the closing price and ends above the opening price of the preceding candlestick pattern. In other words, the second bullish candlestick formation engulfs the prior bearish candlestick pattern. The Three Outside Up pattern is a Bullish Engulfing pattern with a breakout in the next candle. This pattern is more robust than the Bullish Engulfing pattern.
12. On-Neck Pattern Candlestick Pattern
An on-neck candlestick pattern forms when a long bearish candlestick is followed by a tiny bullish candlestick that follows a downtrend and opens and closes near the preceding candlestick's closure. The on-neck pattern forms after a downtrend when a lengthy real-bodied bearish candle is followed by a smaller real-bodied bullish candle that gaps down on the open but closes around the preceding candle's close. The pattern is known as a neckline because the two closing prices are the same or nearly the same across both candles, producing a horizontal neckline.
13. Bullish Counterattack Candlestick Pattern
A bullish Counterattack is a reversal pattern that indicates that the market's current decline will reverse in the future. This pattern is a two-bar chart that arises during a market decline. To constitute a bullish reversal pattern, the following requirements must be met: There must have been a significant decreasing trend. Then a strong positive candle emerges. The second candlestick must be a lengthy (preferably the same size as the first) green candlestick with a real body; close it much above the first candle's closure.
Bearish Candlestick Pattern
These all are the bearish candlestick pattern:
14. Hanging Man Candlestick Pattern
The Hanging Man is a single candlestick pattern that appears after an uptrend and indicates a bearish reversal. The real body of this candle is tiny and located at the top, with a lower shadow that should be twice the size of the actual body. This candlestick design has minimal to no top shadow. Hanging Man is a single candlestick pattern that occurs at the end of an upswing. This candlestick design has no or little top shadow. The psychology behind this candle formation is that the prices opened, and the seller pushed them down. Buyers suddenly entered the market and drove prices higher, but they were unsuccessful, as prices closed lower than the starting price.
15. Dark Cloud Cover Candlestick Pattern
The Dark Cloud Cover candlestick pattern represents a bearish reversal following an upswing. It is made up of two candles, one with a bullish candle signalling the continuation of the uptrend and the other with a bearish candle that gaps to the upside but closes more than half of the preceding candle's body, suggesting a bearish reversal. This pattern is easily recognised on Japanese candlestick charts because it occurs when a down candle opens above the closing of the previous up candle and closes below the middle of the up candle.
16. Bearish Engulfing Candlestick Pattern
Bearish engulfing is a candlestick pattern that occurs after an upswing and signals a bearish reversal. It is composed of two candlesticks, with the second candlestick enveloping the first. The first candle is bullish and signals the continuation of the rise. The second candle on the chart is a lengthy bearish candle that engulfs the first, indicating that bears have returned to the market.
17. Evening Star Candlestick Pattern
The Evening Star candlestick pattern is formed after an upswing and suggests a bearish reversal. It consists of three candles: the first is a bullish candle, the second is a doji, and the third is bearish. The first candle shows the continuance of the uptrend; the second candle, a doji, represents market hesitation; and the third candle, a bear market, signifies that the bears have returned to the market and a reversal will occur.

18. Three Black Crows Candlestick Pattern
The Three Black Crows is a multiple candlestick pattern that appears after an uptrend and signals a negative reversal. These candlesticks are composed of three lengthy bearish bodies with no long shadows and open within the body of the preceding candle in the pattern.
19. Black Marubozu Candlestick Pattern
The Black Marubozu is a single candlestick pattern that appears following an upswing and signals a negative reversal. This candlestick pattern has a lengthy bearish body and no upper wick or lower shadow, indicating that the bears may be selling and driving the markets lower. Buyers should be cautious and close their purchasing positions when this candle forms.
20. Three Inside Down Candlestick Pattern
Three Inside Down is a multi-candlestick pattern that appears after an upswing and signals a downward reversal. It consists of three candlesticks: the first is a long bullish candle, and the second is a little bearish candlestick that should be inside the range of the first. The third candlestick chart should show a lengthy bearish candlestick, confirming the bearish reversal. The first and second candlesticks should form a bearish Harami candlestick pattern.
21. Bearish Harami Candlestick Pattern
The negative Harami candlestick pattern occurs after an upswing and suggests a negative reversal. It comprises two candles, the first of which is a high bullish candle and the second of which is a little bearish candle, both of which should be located in the first candlestick chart. The first bullish candle represents the continuance of the bullish trend, while the second candle indicates that bears have returned to the market.
22. Shooting Star Candlestick Pattern
The Shooting Star appears at the end of an uptrend and is a negative reversal indicator. In this candlestick chart, the true body is near the end, with a long upper wick.
23. Tweezer Top Candlestick Pattern
The tweezer top candlestick pattern is a bearish candlestick shape that appears after an upswing. It consists of two candles, the first bullish and the second bearish. Both tweezer candles provide practically identical highs. When the tweezer top candlestick pattern appears, the prior trend is upward. A bullish candle is a pattern that seems to be the continuation of an existing upswing. The Tweezer Top pattern is a bearish reversal candlestick pattern that appears after an uptrend.
24. Three Outside Down Candlestick Pattern
The Three Outside Down candlestick formation occurs after an upswing and signals a negative reversal. It consists of three candles: the first is a short bullish candle, and the second is a massive bearish candle that should cover the first. The third candle should be a lengthy bearish candle, which confirms the bearish reversal.
25. Bearish Counterattack Candlestick Pattern
The Bearish Counterattack The candlestick pattern is a negative reversal pattern during a market uptrend. It indicates that the market's current upswing will expire and a new decline will take over.
Continuation Candlestick Pattern
Here are the continuation candlestick patterns:
26. Doji Candlestick Pattern
The doji pattern is an uncertain candlestick pattern formed when the starting and closing prices are about identical. It forms when both bulls and bears compete for price control, but none succeeds in acquiring complete control.
27. Spinning Top Candlestick Pattern
The spinning top candlestick pattern, like the doji pattern, shows market indecision. The sole distinction between the spinning top and the doji is in their formation; the spinning top has a bigger actual body than the doji.

28. Falling Three Methods Candlestick Pattern
The falling three ways is a bearish five-candlestick continuation pattern that suggests a break but no reversal in the current decline. The candlestick pattern is made up of two long candlestick charts in the direction of the trend, i.e. a decline at the start and finish, and three shorter candlesticks in the middle to offset the downtrend. The "falling three methods" is a bearish, five-candle continuation pattern that indicates a break, but not a reversal, in the current downturn. The candlestick pattern consists of two long charts in the direction of the trend (downtrend) at the beginning and conclusion, and three shorter counter-trend candlesticks in the centre.
29. Rising Three Methods Candlestick Pattern
The "Rising Three Methods" is a bullish five-bar continuation pattern that indicates a break, but not a reversal, in the current uptrend. This candlestick pattern consists of two long candlesticks in the direction of the trend, which is an uptrend, at the beginning and conclusion, and three shorter candlesticks in the centre that are contrary to the trend.
30. Upside Tasuki Gap Candlestick Pattern
Upside Tasuki is a bullish continuation candlestick pattern generated during an upswing. This candlestick configuration consists of three candles. The first candle is an extended bullish candle, and the second candle forms following an upward gap. It is a bullish continuation candlestick pattern generated during a continuing upswing.
31. Downside Tasuki Gap Candlestick Pattern
It is a bearish continuation candlestick pattern generated during a continuing decline. This candlestick pattern consists of three candles: the first is a long-bodied bearish candlestick, and the second is a bearish candlestick developed after a gap down. The third candlestick is a bullish candle that closes the gap produced by the previous two bearish candles.
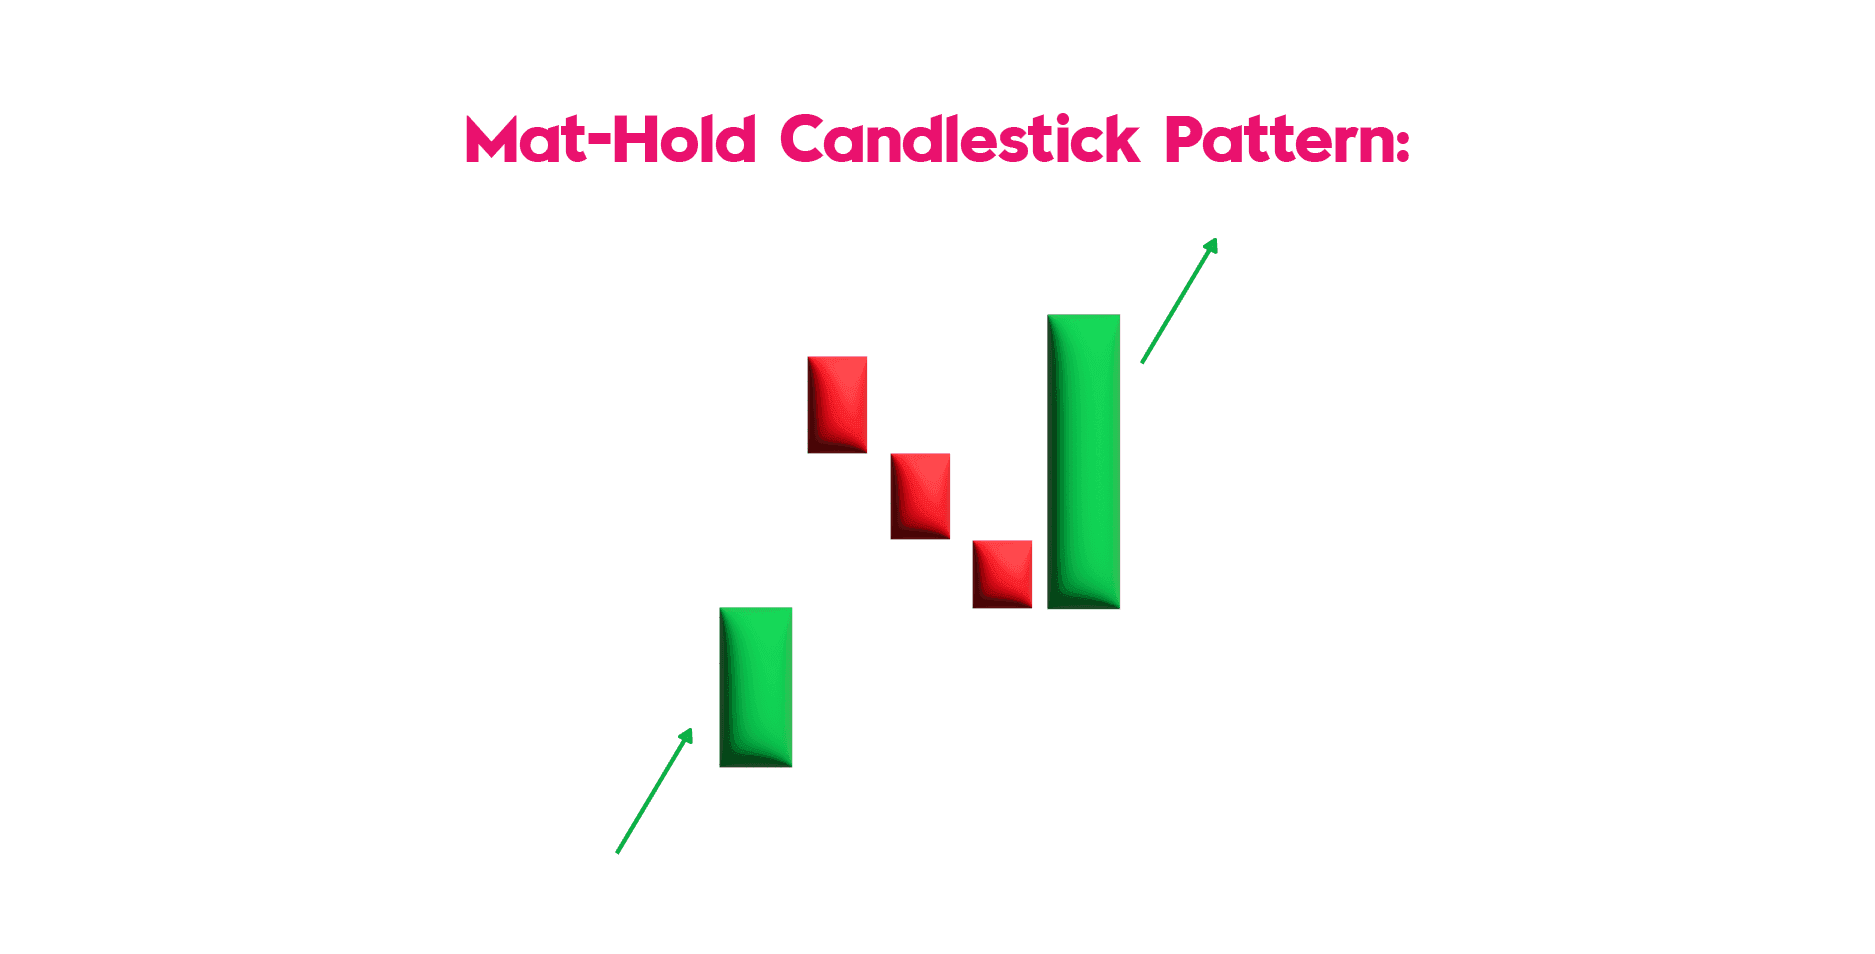
32. Mat-Hold Candlestick Pattern
A mat-hold pattern is a candlestick shape that shows the continuance of a preceding trend. There are bullish and bearish mat-hold patterns. A bullish pattern begins with a giant bullish candle, then a gap to the upside and three smaller candles heading downward. These candles must remain above the base of the first candle. The fifth candle is a huge candle that moves back up. The pattern happens during a broad rise.
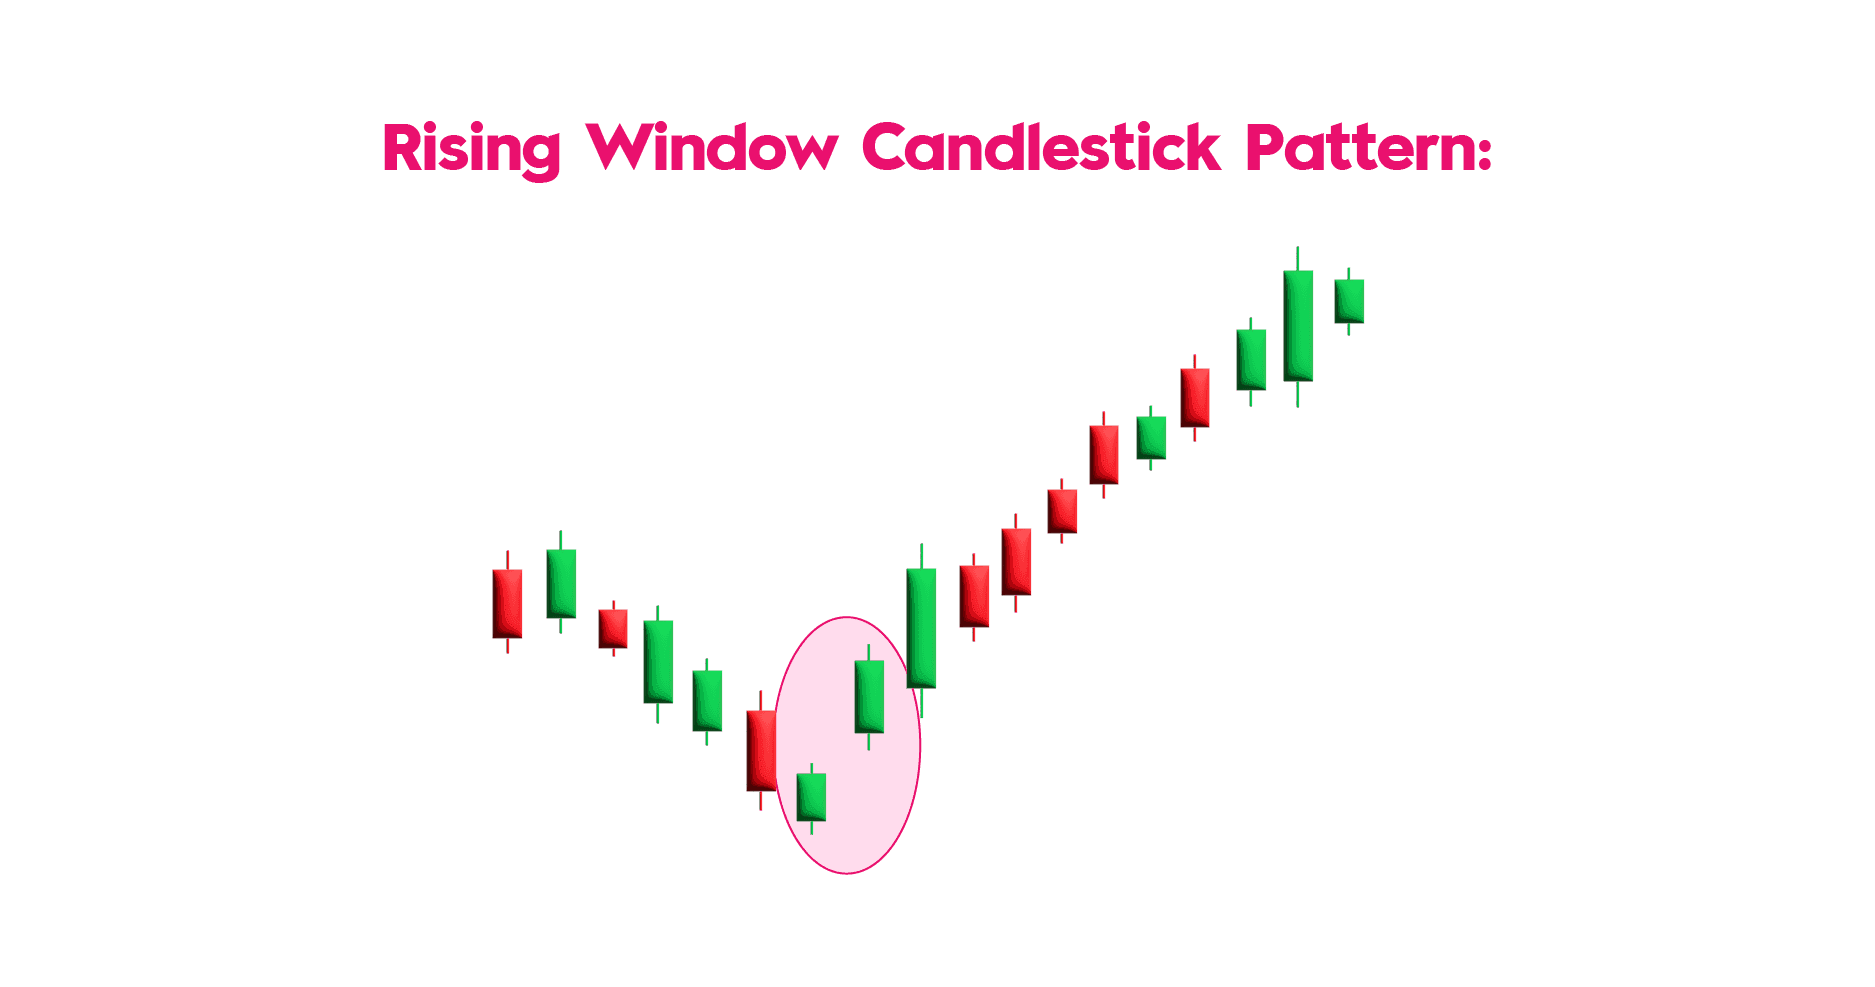
33. Rising Window Candlestick Pattern
The Rising Window candlestick pattern consists of two bullish candlesticks separated by a gap. The gap is the difference between the highs and lows of two candlesticks that result from high trading volatility. It is a trend continuation candlestick pattern that signals the market has strong buyers.
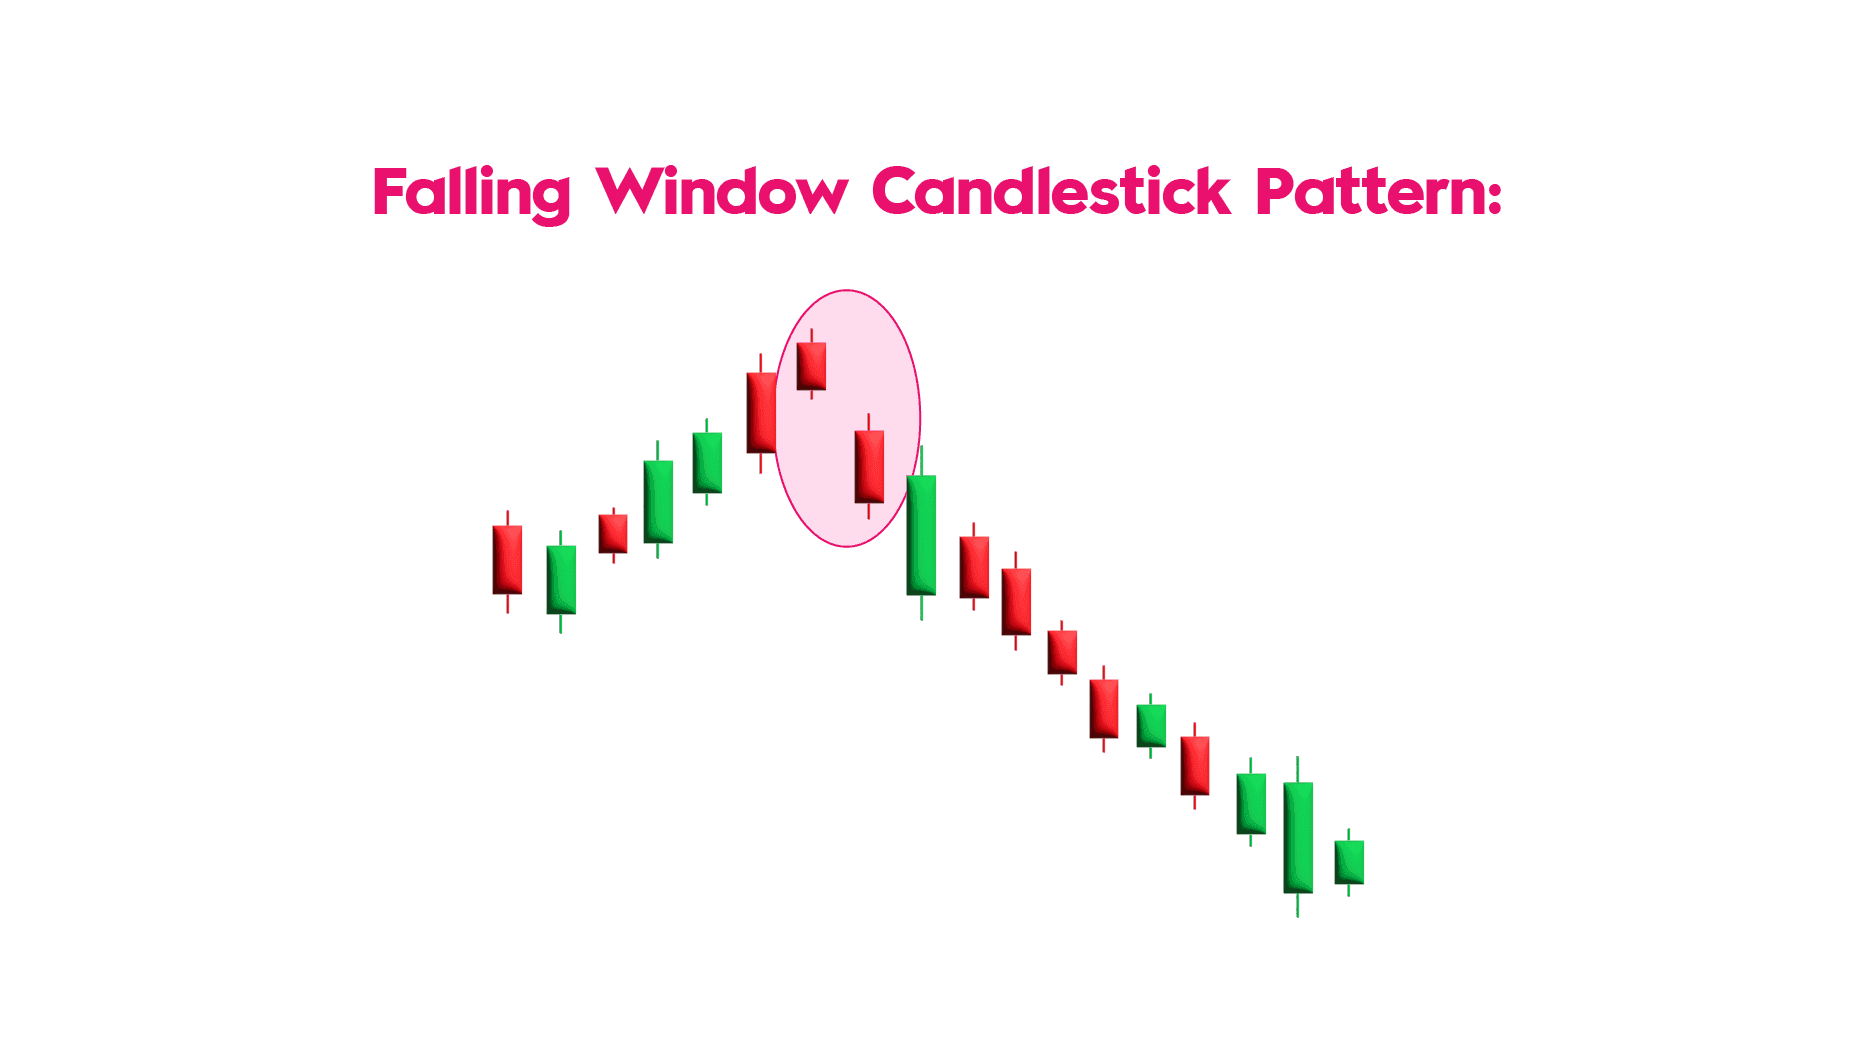
34. Falling Window Candlestick Pattern
The falling window candlestick pattern consists of two bearish candlesticks separated by a gap. The gap is the distance between the highest and lowest points of two candlesticks. This is a trend continuation candlestick pattern indicating the market's selling power.
35. High Wave Candlestick Pattern
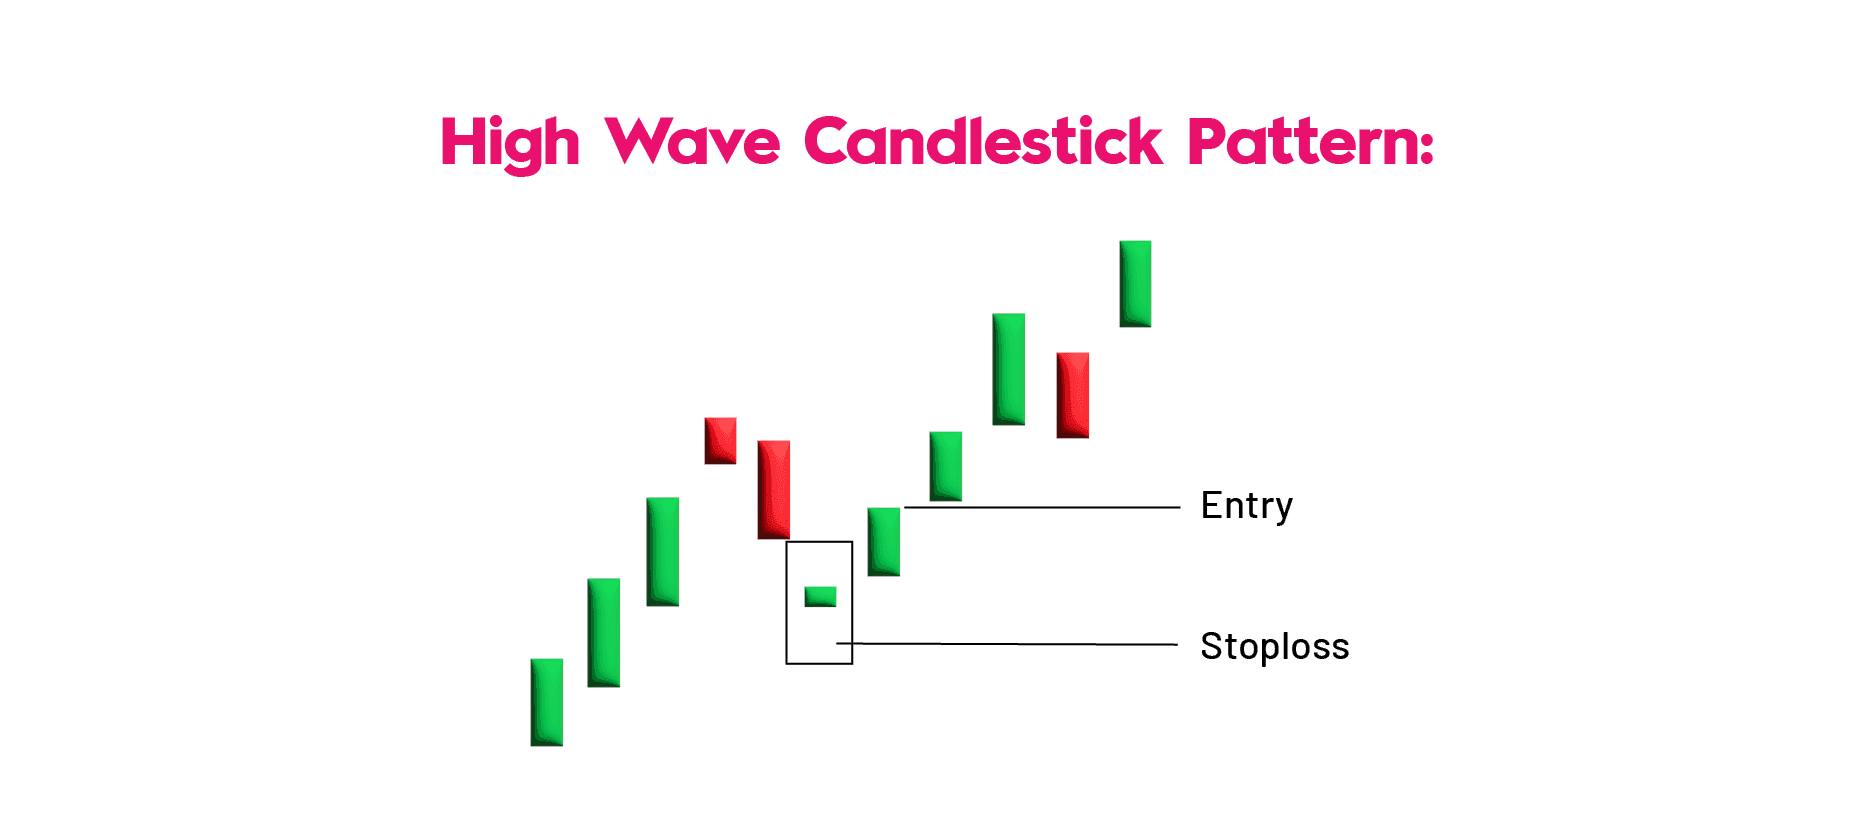 The high wave candlestick pattern represents indecision, indicating that the market is neither bullish nor bearish. It mostly happens at the support and resistance levels. The high wave candlestick pattern represents indecision, indicating that the market is neither bullish nor bearish. It mostly happens at the support and resistance levels. Bears and bulls compete to drive the price in a specific direction. Candlesticks show a pattern with long lower shadows and long higher wicks. Similarly, they have tiny bodies. The lengthy wicks indicate a significant amount of price movement throughout the provided time. However, the price finally closed near its opening price.
How to Read Candlestick Patterns
Candlestick pattern reading requires analyzing the size, shape, and location of the candlesticks relative to the general trend of the market. It is important not to focus only on the pattern but also to take into account other elements, such as support and resistance, volume, etc.
In the course of reading the 35 strongest candlestick patterns, one must be careful about looking for confirmation before placing an order.
How to Trade Using Candlestick Patterns
Trading on Candlesticks Patterns starts by recognizing the pattern and analyzing the signal that pattern gives. After recognizing the pattern, traders normally verify their signal through technical indicators like moving averages, RSI, and MACD.
For instance, the Bullish Engulfing formation near support level might be a signal for purchase, whereas Bearish Engulfing formation near resistance level would suggest sell. Utilizing 35
highly powerful candlesticks patterns in addition to appropriate risk management strategies may enhance traders' trading skills.
Advantages of Candlestick Patterns
The widespread use of candlestick patterns is attributed to their straightforwardness and visualization, which makes analyzing the behavior of the markets much easier.
The advantages that characterize the 35 effective candlestick patterns include:
- Simple to comprehend and analyze
- Useful in various markets and time frames
- Identify market trends, whether reversal or continuation
- Combination with other tools is possible
- Market sentiment analysis
These aspects make candlestick patterns a beneficial addition to traders of all levels.
Candlestick Patterns vs Chart Patterns
Both candlestick patterns and chart patterns play an important role in technical analysis; however, both these techniques differ from each other in terms of their formation and significance.
A candlestick pattern is constructed with the help of one or just a few candles and serves to give short-term trading signals to a trader. In contrast, chart patterns like Head and Shoulders, Double Tops, Triangles, and Flags are created over a longer time span and help recognize long-term trends in the market.
While the study of chart patterns emphasizes price structure, there are 35 highly valuable candlestick patterns that serve to give faster conclusions about market sentiment.
Conclusion
Candlestick patterns in the stock market offer traders a practical way to analyze price movements and predict future trends. These patterns reflect trader emotions and market sentiment, helping to identify potential reversals or continuations. The 35 powerful candlestick patterns are especially useful for long-term and swing traders who rely on daily price action for analysis.
Learning the best 35 candlestick patterns for trading enhances a trader’s ability to read charts, align with market trends, and develop effective strategies. Knowing how to use 35 candlestick patterns in stock trading is key to making informed decisions, whether you're holding positions or day trading. The 35 candlestick pattern strategy for day trading focuses on spotting reliable.
FAQs on Candlestick Patterns in the Stock Market
What is a 15-minute timeframe strategy?
Traders may profit from shifts in market sentiment by identifying inside candles on a 15-minute timeframe chart and trading in the direction of the breakout.
Which is the rarest candlestick pattern?
The Concealing Baby Swallow candlestick design is among the most unusual.
How to read the candlestick pattern?
A short upper wick on a red candle indicates the stock opened around its daily high. In contrast, a short upper wick on a green candle indicates that the stock closed close to its daily high.
How can you forecast the next candlestick?
If the real component is positive, we anticipate a bullish candlestick; if it is negative, we predict a bearish candlestick; and if it is zero, we forecast a neutral candlestick.
What is the 5-Minute Candle Strategy?
This trading approach seeks momentum bursts on short-term, 5-minute currency trading charts that a market player may profit from before rapidly exiting as the momentum fades.
What are candlestick patterns in stock market?
A candlestick pattern is a formation on a chart composed of one or several candlesticks. Candlestick patterns are used to understand the trends of a certain stock and to make predictions based on how those trends will continue. The trader can use any of the 35 powerful candlestick patterns when trading stocks.
Which candlestick pattern is most reliable?
It is not guaranteed that there is any one particular candlestick formation that would be completely consistent. Nevertheless, there are many popular candlestick formations, including bullish engulfing, bearish engulfing, morning star, evening star, and hammer. The success of these formations may increase if they are used together with volume study, support and resistance, etc.
How many candlestick patterns are there?
There are hundreds of candlestick patterns utilized in the technical analysis field, some consisting of only one candlestick while others involving multiple candlesticks. Although their classifications vary among resources, there are 35 highly effective candlestick patterns recognized by most traders for predicting trends and reversal signals in the market.
Are candlestick patterns useful for beginners?
Yes, candlestick patterns are helpful to beginners since they offer a graphical representation of market behaviour. The knowledge of the 35 most effective candlestick patterns will be very beneficial in learning about price action and how to trade effectively. It is, however, important to note that candlestick patterns should be complemented by other techniques of risk management and analysis.