
What is a Tweezer Bottom Candlestick Pattern? Meaning, Formation & Trading Strategy
- 29 Sept 2026
- By: BlinkX Research Team


- ▶<span lang="EN-US" dir="ltr"><strong>Key Components and Characteristics</strong></span>
- ▶<span lang="EN-US" dir="ltr"><strong>How Does a Tweezer Bottom Pattern Form?</strong></span>
- ▶<span lang="EN-US" dir="ltr"><strong>What Does a Tweezer Bottom Indicate?</strong></span>
- ▶<span lang="EN-US" dir="ltr"><strong>Tweezer Bottom vs Tweezer Top</strong></span>
- ▶<span lang="EN-US" dir="ltr"><strong>How to Trade the Tweezer Bottom Pattern?</strong></span>
- ▶<span lang="EN-US" dir="ltr"><strong>Volume Confirmation in Tweezer Bottom Pattern</strong></span>
- ▶<span lang="EN-US" dir="ltr"><strong>Conclusion</strong></span>
A tweezer bottom candlestick pattern is a technical chart formation that appears after a downward price movement. It typically forms when two consecutive candles show similar lows. This article explains the formation, interpretation, and trading approach related to tweezer bottom candlestick patterns for market analysis.
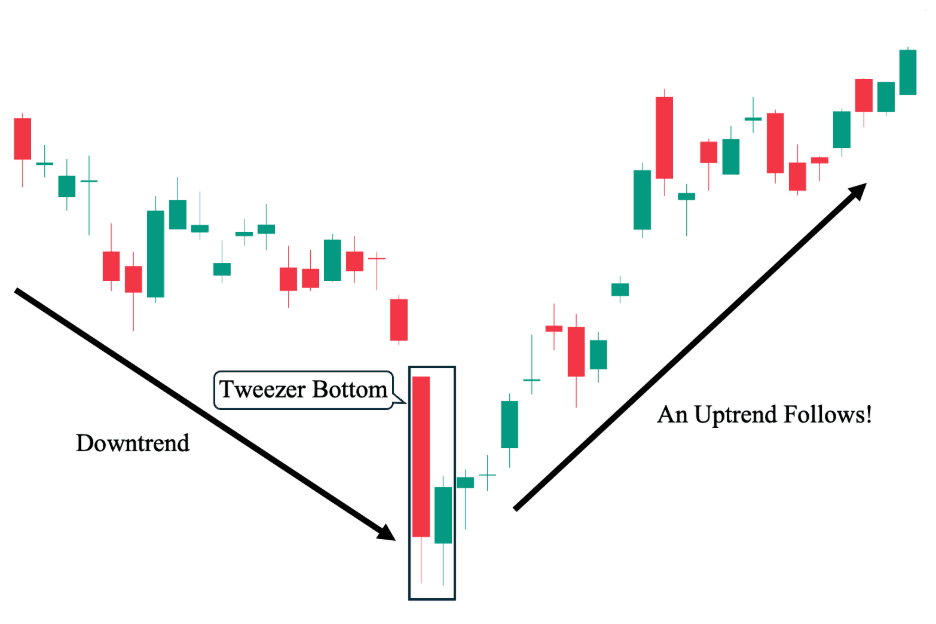
Refer Image – BlinkX Teams needs to add similar kind off image
Key Components and Characteristics
The tweezer bottom candlestick pattern has distinct identifying features, such as:
- Context
It usually appears after a consistent downtrend where prices decline before reaching a support level. - Structure
The lows of two consecutive candlesticks are almost identical, forming a support zone. - First Candle
It is usually bearish in nature with high selling pressure and a continuation of the bearish trend. - Second Candle
It is usually bullish in nature with high buying pressure and a rejection of lower prices. - Appearance
The matching lows of both candles create a support level
How Does a Tweezer Bottom Pattern Form?
The tweezer bottom candlestick pattern forms through specific price movements during a downtrend. The following conditions usually lead to its formation.
- Bearish Phase
A strong bearish candle pushes prices lower and reflects continued selling pressure. - Support Formation
The price reaches a level where sellers struggle to push it further downward. - Shift in Market Behaviour
The following session opens near the previous close and begins to show buying activity. - Matching Lows
The second candle’s low remains close to the first candle’s low, forming a support zone. - Buying Momentum
The second candle typically closes higher, indicating improving demand and possible upward movement.
What Does a Tweezer Bottom Indicate?
The tweezer bottom candlestick pattern usually signals possible changes in market direction.
- Market Indecision at Support Levels
It shows a situation where buyers and sellers compete at a specific price level before buyers gain control. - Change in Market Sentiment
The formation may reflect a shift from bearish market behaviour towards bullish.
Tweezer Bottom vs Tweezer Top
Understanding tweezer bottom candle patterns becomes clearer when compared with the opposite formation.
| Basis | Tweezer Bottom | Tweezer Top |
| Market Signal | Bullish reversal signal | Bearish reversal signal |
| Trend Context | Appears after a downtrend | Appears after an uptrend |
| Candle Structure | First bearish candle followed by a bullish candle | First bullish candle followed by a bearish candle |
| Price Level | Matching lows | Matching highs |
| Market Interpretation | Indicates support and buying interest | Indicates resistance and selling pressure |
How to Trade the Tweezer Bottom Pattern?
The tweezer bottom candlestick pattern is typically traded using confirmation-based strategies.
- Confirm the Pattern
Traders generally look for a bullish candle or indicators after the formation. - Place Stop-Loss
Stop-loss orders are often placed below the support level formed by the matching lows.
Volume Confirmation in Tweezer Bottom Pattern
When analyzing a tweezer bottom candlestick pattern, volume confirmation is generally seen as an important factor. Lower volume, however, may reduce the reliability of the pattern. Traders often use volume together with other indicators to confirm market direction.
Conclusion
The tweezer bottom candlestick pattern is a technical formation that may indicate a potential bullish reversal following a downward trend. It appears when the lows of two consecutive candles match, indicating support and weakening selling pressure. Traders generally rely on confirmation signals, volume analysis, and risk management strategies when using this pattern for market decisions.
- BlinkX launches ItsATraderThing Campaign
- blinkX Introduces 'Options Watchlist' to Empower Traders with Real-Time Insights
- BlinkX Enhances Trading with 24/7 Customer Support Capabilities
- Unlocking Seamless Trading: Introducing “Order Slicing” For The FnO Market
- A Game-Changer for Traders: Introducing Horizontal Watchlists
FAQs on Tweezer Bottom Candlestick Pattern
What happens after a tweezer bottom?
After a tweezer bottom forms, prices may move upward if buying momentum increases. However, confirmation through volume or indicators is generally required.
Is a tweezer top bullish or bearish?
A tweezer top is typically considered a bearish reversal pattern that appears after an uptrend and may indicate downward price movement.
How do you identify a valid tweezer bottom?
A valid tweezer bottom usually appears after a downtrend, shows two consecutive candles with similar lows, and is supported by increased buying activity.
What is the tweezer bottom pattern rule?
The main rule is that both candles must have nearly identical lows, indicating strong support and rejection of lower prices.
What happens after the tweezer bottom chart forms?
In many cases, the market may show upward movement, though traders typically wait for confirmation before taking action.