Difference Between Shooting Star and Inverted Hammer
- ▶<span lang="EN-US" dir="ltr"><strong>Inverted Hammer vs Shooting Star</strong></span><strong> </strong>
- ▶<span lang="EN-US" dir="ltr"><strong>What Is an Inverted Hammer Candlestick Pattern?</strong></span><strong> </strong>
- ▶<span lang="EN-US" dir="ltr"><strong>Characteristics of an Inverted Hammer</strong></span><strong> </strong>
- ▶<span lang="EN-US" dir="ltr"><strong>What Is a Shooting Star Candlestick Pattern?</strong></span><strong> </strong>
- ▶<span lang="EN-US" dir="ltr"><strong>Characteristics of a Shooting Star</strong></span><strong> </strong>
- ▶<span lang="EN-US" dir="ltr"><strong>Conclusion</strong></span><strong> </strong>
Candlestick patterns are widely used in technical analysis to interpret potential price movements. Two commonly discussed formations are the shooting star and the inverted hammer. Although both appear visually similar, they generally form different market conditions and signal different possibilities in price behaviour. The inverted hammer usually appears after a downward price movement and may suggest a possible upward reversal. The shooting star, by contrast, forms after an upward movement and may indicate weakening buying pressure. This article explains the difference between a shooting star vs inverted hammer candlestick that may help traders interpret chart signals with more clarity.
Inverted Hammer vs Shooting Star
Let us first understand the difference between an inverted hammer and shooting star patterns side by side.
| Feature | Inverted Hammer | Shooting Star |
| Market Context | Appears in a downtrend, signalling a potential reversal to the upside. | Appears in an uptrend, indicating a possible reversal to the downside. |
| Body Position | A small body is located at the bottom of the candle, showing indecision among traders. | A small body is located at the bottom of the candle, indicating indecision after a bullish trend. |
| Upper Shadow | The long upper shadow signifies that buyers attempted to push prices higher but faced resistance. | The long upper shadow indicates that sellers pushed prices lower after buyers tried to maintain control. |
| Lower Shadow | Little to no lower shadow suggests minimal selling pressure during the session. | Little to no lower shadow shows that buyers were unable to maintain higher prices. |
| Indication | Suggests a potential bullish reversal as buying pressure may be increasing after a downtrend. | This indicates a potential bearish reversal as selling pressure may be increasing after an uptrend. |
| Colour Significance | A green body indicates a stronger bullish sentiment; a red body suggests caution regarding upward momentum. | A green body indicates weaker bearish sentiment; a red body suggests stronger selling pressure ahead. |
| Typical Follow-Up | Often followed by a bullish trend if confirmed by subsequent price action, providing opportunities for long positions. | Often followed by a bearish trend if confirmed by subsequent price action, providing opportunities for short positions. |
Being aware of the se differences of shooting star inverted hammer candlestick is crucial for traders looking to capitalise on market actions properly.
What Is an Inverted Hammer Candlestick Pattern?
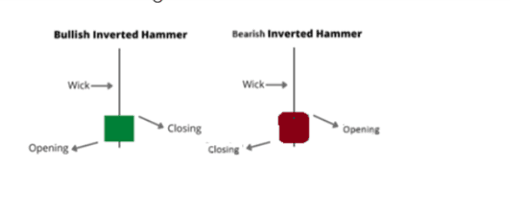
Inverted Hammer is a single candlestick pattern that is normally seen after a decline in a price chart. It has a small body near the lower end of the candle and a long upper shadow. This is an indication of a situation in which buyers are trying to lift the price up despite a previous selling activity. The inverted hammer is normally seen after a decline in a price chart, indicating that buying is beginning to emerge, which could be a change in market direction depending on the support of other candles.
Characteristics of an Inverted Hammer
The inverted hammer candlestick generally shows the following features:
- A small real body positioned near the lower end of the candle
- A long upper shadow that is generally much longer than the body
- Very little or no lower shadow
- Formation after a downward price movement
- A possible early signal of a shift in market sentiment if supported by later price movement
- Often analysed along with nearby price candles to interpret potential reversal signals
What Is a Shooting Star Candlestick Pattern?
A shooting star is a single candlestick pattern that generally forms after a period of rising prices. The candle has a small body near the lower end with a long upper shadow. This structure indicates that buyers initially pushed prices higher during the session, but selling pressure later drove the price back down near the opening level. When it appears after an upward trend, the shooting star may indicate weakening upward momentum and a possible change in market direction if subsequent candles confirm the movement.
Characteristics of a Shooting Star
The shooting star pattern generally includes these features:
- A small real body located near the lower part of the candle
- A long upper shadow that is significantly longer than the body
- Minimal or no lower shadow
- Formation after a sustained upward movement
- Often interpreted as a signal that buying momentum may be slowing
- Typically examined with surrounding candles to understand possible market direction
Conclusion
The shooting star and the inverted hammer are similar in structure, yet they tend to be formed during different stages of the market. The inverted hammer usually occurs during the falling market and may be an indication of the start of buying activity. The shooting star, on the other hand, occurs during the rising market and may be an indication of the weakening of the rising prices. The distinction between the shooting star and the inverted hammer can be useful in the analysis of the price charts with the aid of an online trading app.
- BlinkX launches ItsATraderThing Campaign
- blinkX Introduces 'Options Watchlist' to Empower Traders with Real-Time Insights
- BlinkX Enhances Trading with 24/7 Customer Support Capabilities
- Unlocking Seamless Trading: Introducing “Order Slicing” For The FnO Market
- A Game-Changer for Traders: Introducing Horizontal Watchlists
FAQs on Shooting star vs Inverted hammer
Are shooting stars and inverted hammers the same?
No. The shooting stars and inverted hammers are not the same. Although these two patterns have the same features, such as the body being short and the upper shadow being long, their meaning varies because of their location on the price chart. The inverted hammer usually occurs after a fall, and the shooting star usually occurs after an increase, which may indicate a change in the direction of the price movement, either upward or downward, respectively.
Can these patterns be applied to different timeframes?
Yes, these patterns may be found on various charts with different time frames, such as minutes, hours, or days. The trend and technical analysis are generally considered by traders before making any decision, regardless of the time frame.
Are shooting star candlesticks accurate?
Shooting stars candlesticks are likely to be accurate indications of reversals. In addition, confirmation by following candles makes them reliable.
What is the indication of an inverted hammer?
An inverted hammer indicates a possible bullish reversal after a downtrend; that is, buyers may be gaining strength.
What is the difference between a hammer-hanging man and a shooting star?
The difference between an inverted hammer and a shooting star is that a hammer appears in a downtrend signalling bullishness, while both a hanging man and shooting star appear in uptrends signalling bearishness—a hanging man signals weakness in buying pressure, while a shooting star signals strong selling pressure.