What is On Balance Volume (OBV) Indicator?
- ▶<span lang="EN-US" dir="ltr"><strong>How Does OBV Indicator Works?</strong></span><strong> </strong>
- ▶<span lang="EN-US" dir="ltr"><strong>How to Calculate the OBV Indicator Value?</strong></span><strong> </strong>
- ▶<span lang="EN-US" dir="ltr"><strong>How Do You Interpret OBV?</strong></span><strong> </strong>
- ▶<span lang="EN-US" dir="ltr"><strong>Benefits & Limitations of Using OBV Indicator</strong></span><strong> </strong>
- ▶<span lang="EN-US" dir="ltr"><strong>Conclusion</strong></span><strong> </strong>
The OBV full form is On Balance Volume, it is a volume-based technical indicator. It generally helps track the flow of trading volume to understand whether buying or selling pressure is building in a stock. OBV links price changes with volume data to show market activity patterns which extend beyond price analysis. Traders often use it to confirm trends, spot possible reversals, or identify early signals of momentum. This article explains how OBV works, how it is calculated, and how it can be interpreted
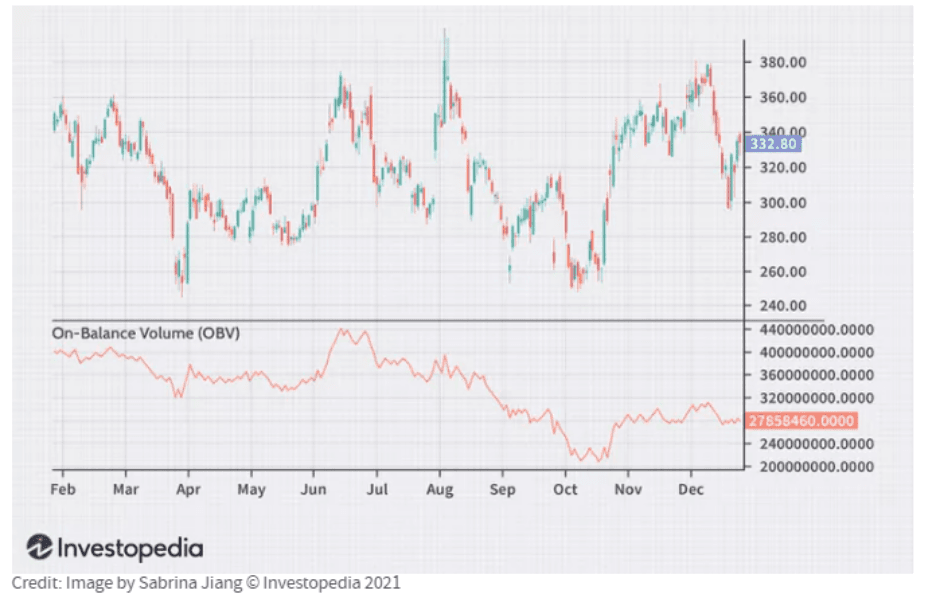
Note: Refer this Image as we need to create image like this.
How Does OBV Indicator Works?
Understanding how the OBV indicator works may help clarify the OBV meaning, especially in terms of how volume and price movements are connected over time.
- It starts with an initial OBV value, usually set at zero or a chosen base
- If the current closing price is higher than the previous closing price, the day’s volume is added to OBV
- If the closing price is lower, the day’s volume is subtracted from OBV
- If there is no change in closing price, OBV remains unchanged
- Over time, this creates a cumulative total that reflects buying or selling pressure
- A rising OBV may suggest accumulation (buying interest), while a falling OBV may indicate distribution (selling interest)
Traders often compare OBV movement with price trends to identify confirmations or divergences
Example:
Consider a situation where the OBV values over a few trading sessions are 1,000, 1,400, 1,250, 1,700, 1,550, and 1,900. As the stock price moves up on most of these days, the OBV generally trends higher, even with small dips in between. This pattern may suggest that buying pressure is gradually increasing.

Note: Refer this Image as we need to create image like this.
How to Calculate the OBV Indicator Value?
The On Balance Volume indicator is calculated using a simple rule-based approach, where volume is added or subtracted depending on price movement.
- When today’s closing price is higher than yesterday’s, the day’s total volume is added to the previous OBV value
OBV (current) = OBV (previous) + Volume (current)
- When today’s closing price is lower than yesterday’s, the day’s volume is subtracted from the previous OBV value
OBV (current) = OBV (previous) − Volume (current)
- When the closing price remains the same, the OBV value does not change
OBV (current) = OBV (previous)
Step-by-step example:
- Imagine the previous OBV value is 4,000. On the next day, the stock closes higher than the previous day and the total traded volume is 600. In this case, the volume is added, so the new OBV becomes 4,600.
- On the following day, the stock closes lower and the volume is 300. This time, the volume is subtracted, bringing the OBV down to 4,300.
- If on the next day the closing price remains unchanged, the OBV will stay at 4,300.
This step-by-step adjustment shows how OBV changes based on price direction and helps reflect the overall flow of volume.
How Do You Interpret OBV?
Interpreting OBV usually involves observing its relationship with price and identifying patterns.
- Trend Confirmation
When OBV and price move in the same direction, the ongoing trend may be considered more reliable - Positive Divergence
If price is falling but OBV starts rising, it may indicate that buying interest is building quietly - Negative Divergence
If price is rising but OBV is flat or falling, it may suggest weakening upward momentum - Breakout Signals
A sharp upward move in OBV before a price breakout may indicate early accumulation - Support & Resistance Behaviour
OBV may form its own trendlines. Breaks in these levels can sometimes hint at future price movement - Volume-led Moves
Sudden spikes in OBV could reflect strong participation, which may influence price direction
Benefits & Limitations of Using OBV Indicator
There are practical advantages as well as certain constraints when using OBV.
Benefits of Using OBV Indicator | Limitations of Using OBV Indicator |
| Tracks volume flow, not just price movement | Does not indicate exact entry or exit points |
| May help identify early trend signals | Can give misleading signals in low-volume stocks |
| Simple calculation and easy to apply on charts | Ignores magnitude of price change |
| Useful for spotting divergence patterns | Not very effective in sideways markets |
| Can support confirmation of breakouts | Needs to be combined with other indicators for clarity |
Conclusion
The OBV indicator shows how volume patterns relate to price movements which helps traders determine changing market conditions between buying and selling activities. While it can highlight trends and possible reversals, it is generally more effective when used alongside other indicators. Over time, consistent observation may improve interpretation. Many traders analyse OBV using an online trading app, where charts and tools are available, allowing them to study patterns and make more informed trading decisions.
- Taxation of Dividend Income in India: Rules, TDS & Everything Investors Need to Know
- Tax Saving Bonds India: A Smart Way to Grow Wealth
- Devolvement in Commodity Options: Meaning, Process, Margins & Settlement Explained
- Commodity Valuation: What It Is, How It Works, and Why It Matters
- Personal Loan for Trading: Should You Borrow Money to Invest in Stocks?
- BlinkX launches ItsATraderThing Campaign
- blinkX Introduces 'Options Watchlist' to Empower Traders with Real-Time Insights
- BlinkX Enhances Trading with 24/7 Customer Support Capabilities
- Unlocking Seamless Trading: Introducing “Order Slicing” For The FnO Market
- A Game-Changer for Traders: Introducing Horizontal Watchlists
FAQs on OBV Indicator
Is on-balance volume a good indicator?
OBV is often considered useful for identifying volume trends and confirming price movements. However, it is usually combined with other indicators for better accuracy.
What is the on-balance volume formula?
It is a cumulative indicator where volume is added when price rises, subtracted when price falls, and remains unchanged when price remains the same.
What is the on-balance volume setting?
OBV typically does not require custom settings. It is automatically calculated using price and volume data available on charts.
What is better than the OBV indicator?
There is no single indicator that replaces OBV. Traders often use it with RSI, MACD, or moving averages for a more balanced view.
Is On-Balance Volume leading or lagging?
OBV is generally seen as a leading indicator, as changes in volume may appear before noticeable price movements.