What is Inverse Head and Shoulders Pattern?
- ▶<span lang="EN-US" dir="ltr"><strong>How to Identify an Inverse Head and Shoulders Pattern</strong></span><strong> </strong>
- ▶<span lang="EN-US" dir="ltr"><strong>Characteristics of Inverse Head and Shoulders Patter</strong></span><strong> </strong>
- ▶<span lang="EN-US" dir="ltr"><strong>Benefits and Limitations of Inverse Head and Shoulders</strong></span><strong> </strong>
- ▶<span lang="EN-US" dir="ltr"><strong>Conclusion</strong></span><strong> </strong>
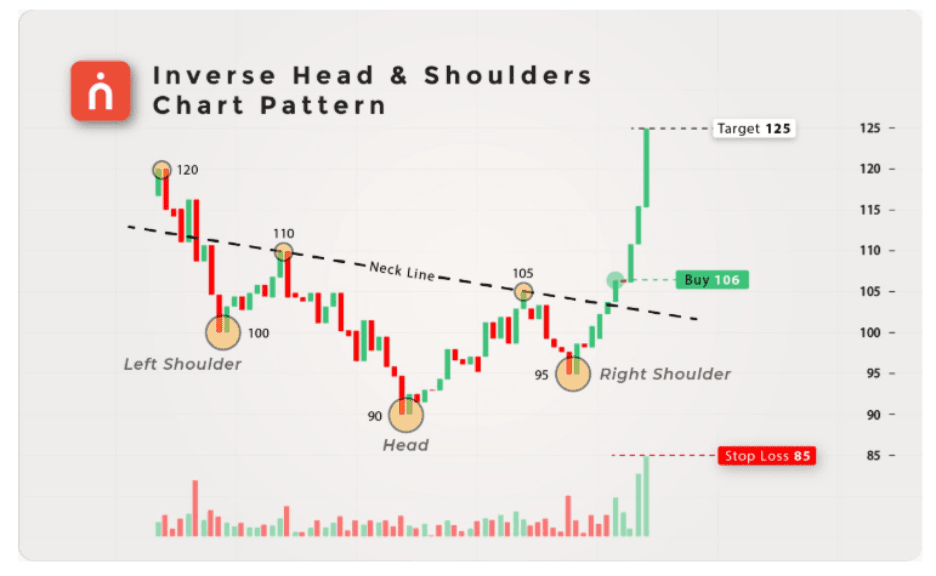
An inverse head and shoulders pattern is a bullish reversal pattern. In technical analysis, this pattern signals a potential shift from a downtrend to an uptrend. The head and shoulders chart pattern is formed when the price creates three successive lows, where the middle low (head) is deeper than the two outer lows (shoulders), and a neckline is formed by connecting the highs between them. This pattern indicates that the selling pressure is weak and the buyers are gaining control. One can confirm this pattern when the price breaks above the neckline with strong volume. This article explains the inverse head and shoulders pattern meaning, how to identify it, and more.
Note: Refer this Image as we need to create image like this.
How to Identify an Inverse Head and Shoulders Pattern
To determine the inverse head and shoulders pattern, traders may use the steps as illustrated below:
- Prior Downtrend: This trend is typically created once the downward price trend has been observed, which shows a potential reversal.
- Left Shoulder Formation: The first low is formed with a slight fall and rise in price.
- Head Formation: Price declines further to form a deeper low than the shoulders, followed by a recovery.
- Right Shoulder Formation: Price drops again but forms a higher low compared to the head, showing reduced selling pressure.
- Neckline Formation: A resistance line (neckline) is drawn by connecting the highs between the shoulders and the head.
- Breakout Confirmation: This is confirmed when the price breaks out above the neckline and with larger volume.
Example: Assume that a share declines from 300 to 250 (left shoulder), then to 220 (heads), and again to 240 (right shoulder). A breakout of price above the neckline at 260 with a good amount of volume is an indication that the price would shift into an upward direction.
Note: Refer this Image as we need to create image like this.
Characteristics of Inverse Head and Shoulders Patter
The following are the key characteristics of the inverse head and shoulders pattern.
- Forms After a Downtrend: This pattern will normally be seen after a long period of falling prices, when the current bearish movement may be wearing out and a turnaround may take place.
- Three Distinct Lows (Shoulder-Head-Shoulder): It is composed of three lows with the middle low (head) the lowest and the two outer lows (shoulders) comparatively higher which gives it a distinct structure.
- Weakening Selling Pressure: With each consecutive decline the intensity is decreased, indicating that sellers are slowly losing their grip, and buyers are beginning to enter the market.
- Neckline Resistance Level: A neckline is a line between the shoulders and the head; it is a major resistance level that is used to confirm.
- Breakout Confirms Reversal: The trend is confimed in case of the price breaking up the neckline, and this shows the inversion of the downward trend into an upward trend.
Benefits and Limitations of Inverse Head and Shoulders
The table below shows the benefits and limitations of inverse head and shoulders chart pattern.
Metric | Benefits | Limitations |
| Trend Signal | Clearly indicates a bullish reversal after a downtrend. | May give false signals if the breakout is not confirmed. |
| Ease of Identification | Recognisable due to the shoulder–head–shoulder structure. | Can be confused with similar reversal patterns. |
| Entry Opportunity | Provides a clear buying opportunity after neckline breakout. | Late entry after breakout may reduce profit potential. |
| Risk Management | Allows stop-loss placement below the right shoulder. | Losses may occur if the pattern fails and reverses. |
| Reliability | Considered reliable when supported by volume confirmation. | Less effective in highly volatile or sideways markets. |
| Volume Confirmation | Increased volume during breakout strengthens the signal. | Volume patterns may not always be consistent. |
| Target Calculation | Helps estimate price targets using pattern height. | Price may not always reach the expected target level. |
Conclusion
The inverse head and shoulders chart pattern indicates a bullish reversal trend, which alerts that the market might experience a change of direction from a downward to an upward trend. It suggests a weakening selling pressure and increasing buyer power expressed in its unique form of three lows and neckline breakout. To enhance accuracy, it is recommended to combine it with volume analysis and technical indicators. Such patterns can also be tracked using an online trading app by investors to analyse and perform trades in real time more easily.
- Taxation of Dividend Income in India: Rules, TDS & Everything Investors Need to Know
- Tax Saving Bonds India: A Smart Way to Grow Wealth
- Devolvement in Commodity Options: Meaning, Process, Margins & Settlement Explained
- Commodity Valuation: What It Is, How It Works, and Why It Matters
- Personal Loan for Trading: Should You Borrow Money to Invest in Stocks?
- BlinkX launches ItsATraderThing Campaign
- blinkX Introduces 'Options Watchlist' to Empower Traders with Real-Time Insights
- BlinkX Enhances Trading with 24/7 Customer Support Capabilities
- Unlocking Seamless Trading: Introducing “Order Slicing” For The FnO Market
- A Game-Changer for Traders: Introducing Horizontal Watchlists
FAQs on Inverse Head and Shoulders Pattern
What does the inverse head and shoulders pattern signify?
It signifies a potential trend reversal from a downtrend to an uptrend, indicating that buyers are gaining control over sellers.
What is the probability of success for the inverted head and shoulders pattern?
The success rate is generally considered moderate to high, especially when the breakout is supported by strong volume and occurs in a clear trend.
How can I use the inverted head and shoulders pattern?
You can use it to identify buying opportunities by entering a trade after the price breaks above the neckline, along with proper risk management.
In an inverse head and shoulders, what is the meaning of the ‘neckline’?
The neckline is a resistance level formed by connecting the highs between the shoulders and the head, and it acts as the breakout point for confirmation.
How reliable is an inverted head and shoulders pattern?
It is considered relatively reliable when confirmed with volume and used along with other technical indicators, but it may fail in volatile markets.