What are Harmonic Patterns?
- ▶<span lang="EN-US" dir="ltr"><strong>How to Identify Harmonic Patterns?</strong></span><strong> </strong>
- ▶<span lang="EN-US" dir="ltr"><strong>Types of Harmonic Patterns</strong></span><strong> </strong>
- ▶<span lang="EN-US" dir="ltr"><strong>How to Trade Using Harmonic Patterns?</strong></span><strong> </strong>
- ▶<span lang="EN-US" dir="ltr"><strong>Benefits & Limitations of Using Harmonic Patterns</strong></span><strong> </strong>
- ▶<span lang="EN-US" dir="ltr"><strong>Conclusion</strong></span><strong> </strong>
Harmonic patterns are structured price formations in financial markets that use Fibonacci ratios to identify potential reversal zones. By recognising recurrent geometric shapes in charts, these harmonic patterns assist traders in precisely analysing price fluctuations. In practice, harmonic patterns help identify entry and exit positions frequently. Traders use these patterns to analyse market activity, reduce risk, and make better decisions. Professionals use harmonic patterns along with indicators to validate signals and improve their overall harmonic trading pattern approach.

Note: Refer this Image as we need to create image like this.
How to Identify Harmonic Patterns?
Understanding what are harmonic patterns gets easier when traders learn to identify them on price charts using criteria and ratios.
- Search for Geometric Shapes: Market shifts between highs and lows throughout time are represented by harmonic patterns, which create distinctive shapes like M or W structures.
- Use Fibonacci Retracements: To identify possible reversal zones and confirm harmonic patterns, traders use Fibonacci ratios such as 0.382, 0.618, and 1.618.
- Verify Price Leg Symmetry: Harmonic trading patterns preserve proportionate movement between legs, ensuring balance between bullish and bearish phases.
- Determine the Important Points (X, A, B, C, D): The structure and completion zone of each harmonic pattern are defined by a series of points.
- Confirm Reversal Zones (PRZ): Harmonic patterns become relevant when the price enters the Potential Reversal Zone, indicating a likely change.
Example:
In a Gartley harmonic pattern, price forms an X-A-B-C-D structure where each leg aligns with Fibonacci ratios. When the price reaches point D, traders anticipate a reversal. If supported by additional signals, harmonic patterns provide a potential entry for trade execution.

Note: Refer this Image as we need to create image like this.
Types of Harmonic Patterns
Fibonacci ratios are utilised in harmonic trading patterns, and each type of harmonic pattern has its own distinct structure.
1. Gartley Pattern
The Gartley Harmonic pattern is one of the first harmonic patterns. It uses Fibonacci retracements and a particular XABCD structure to pinpoint possible market reversal zones.
2. Bat Pattern
The Bat Harmonic pattern depends on specific Fibonacci levels, particularly the 0.886 retracement. This harmonic pattern is used by traders to identify significant, low-risk reversal possibilities.
3. Butterfly Pattern
The Butterfly Harmonic pattern goes beyond the first range of prices. It is helpful in recognising overextended market circumstances within harmonic patterns since it frequently indicates reversal at extreme points.
4. Crab Pattern
The Crab Harmonic pattern is known for its unique extension levels, which frequently reach 1.618 or higher. At significant price extremes, this harmonic pattern helps traders in identifying sudden reversals.
5. Shark Pattern
The Shark Harmonic pattern is a recent development that emphasises short-term reversals. It refers to Fibonacci-based concepts but differs slightly from conventional harmonic patterns.
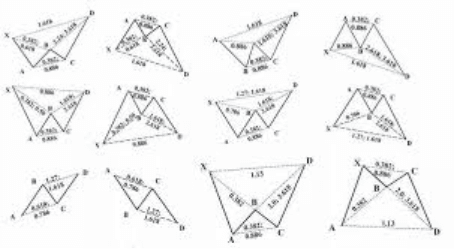
Note: Refer this Image as we need to create image like this.
How to Trade Using Harmonic Patterns?
Trading harmonic patterns involves discipline, confirmation, and a methodical technique to efficiently manage risk inside harmonic trading patterns.
Step 1: Find the Pattern
Traders first use geometric formations and Fibonacci tools to search charts for harmonic patterns. Before continuing, it is crucial to accurately detect harmonic patterns.
Step 2: Mark the Potential Reversal Zone (PRZ).
It is believed that harmonic patterns will finish in the PRZ. Fibonacci extensions are used by traders to identify this zone and get ready for potential trade entrance.
Step 3: Wait for Confirmation Signal
Before entering a trade, traders search for candlestick confirmations, volume shifts, or indicator indications that match harmonic patterns for better accuracy.
Step 4: Make a Trade
When harmonic patterns exhibit reversal; entry is typically positioned close to the PRZ. To minimise false signals in harmonic trading patterns, traders avoid premature entries.
Step 5: Set Stop-Loss and Target
While profit targets are established using Fibonacci levels or prior support and resistance zones, stop-loss levels are positioned beyond the PRZ to restrict losses.
Benefits & Limitations of Using Harmonic Patterns
Harmonic patterns provide organised trading insights, but knowing their benefits and drawbacks enables traders to apply harmonic patterns more effectively in real market settings.
Benefits of Using Harmonic Patterns | Limitations of Using Harmonic Patterns |
| Harmonic patterns give clear trade setups based on price structure and ratios. | Harmonic patterns can be difficult to understand for new traders. |
| They help traders find better entry and exit points in the market. | Wrong identification of harmonic patterns can lead to losses. |
| Harmonic patterns work on different timeframes, from intraday to long-term charts. | Sudden market moves can break harmonic patterns quickly. |
| They support disciplined trading by following fixed rules and levels. | Traders need practice to use harmonic patterns correctly. |
Conclusion
Harmonic patterns use Fibonacci ratios and geometric shapes to give traders a disciplined approach to analysing market movements. Traders can more precisely plan entry and identify potential reversal zones by studying harmonic patterns. They may be useful in decision-making, but also require patience, practice, and confirmation signals to produce reliable results. To achieve better results, many traders include harmonic trading patterns into better strategies. In contemporary markets, instruments like an online trading app assist traders in monitoring charts, using indicators, and making profitable trades while utilising harmonic patterns in real-time market conditions.
- Taxation of Dividend Income in India: Rules, TDS & Everything Investors Need to Know
- Tax Saving Bonds India: A Smart Way to Grow Wealth
- Devolvement in Commodity Options: Meaning, Process, Margins & Settlement Explained
- Commodity Valuation: What It Is, How It Works, and Why It Matters
- Personal Loan for Trading: Should You Borrow Money to Invest in Stocks?
- BlinkX launches ItsATraderThing Campaign
- blinkX Introduces 'Options Watchlist' to Empower Traders with Real-Time Insights
- BlinkX Enhances Trading with 24/7 Customer Support Capabilities
- Unlocking Seamless Trading: Introducing “Order Slicing” For The FnO Market
- A Game-Changer for Traders: Introducing Horizontal Watchlists
FAQs on Harmonic Patterns
What are the 7 harmonic patterns?
The seven well-known harmonic patterns are Gartley, Bat, Butterfly, Crab, Shark, Cypher, and AB=CD.
Is harmonic trading profitable?
Harmonic trading may be successful when used with discipline, appropriate risk management, and confirmation signals.
Which harmonic pattern is the best?
No harmonic pattern is generally the best. Traders frequently favour patterns like Gartley or Bat beause of their dependability, but it varies depending on the situation and state of the market.
How to confirm harmonic pattern?
Confirmation includes verifying Fibonacci ratios, validating pattern structure, and supporting the signal with additional indicators like candlestick patterns, volume, or momentum tools.
What is the best time frame for harmonic pattern?
Harmonic patterns are effective over a variety of time periods. Many traders favour 1-hour, 4-hour, or daily charts because they have clearer structures and reduce market noise.