
What is Triple Top Pattern?




- ▶<span lang="EN-US" dir="ltr"><strong>How to Identify a Triple Top Pattern?</strong></span>
- ▶<span lang="EN-US" dir="ltr"><strong>How to Use Triple Top Pattern in Trading?</strong></span>
- ▶<span lang="EN-US" dir="ltr"><strong>Characteristics of Triple Top Pattern</strong></span><strong> </strong>
- ▶<span lang="EN-US" dir="ltr"><strong>Advantages and Disadvantages of Triple Top Pattern</strong></span><strong> </strong>
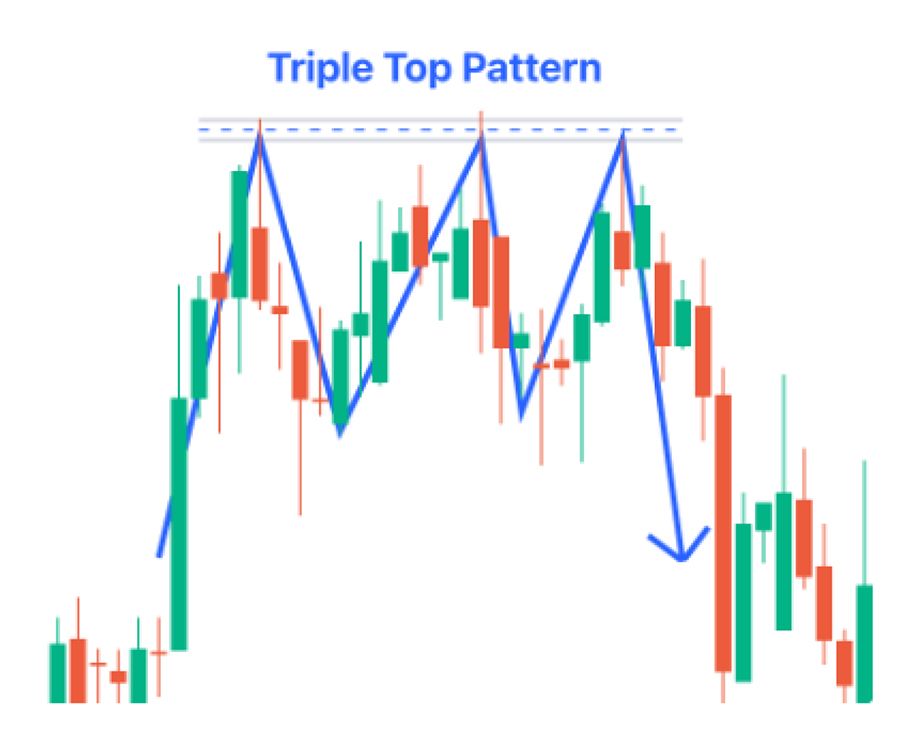
A triple top pattern refers to a bullish reversal pattern that takes place when the price of a stock or asset tests the same resistance level three times but fails to break above it. This shows the weakening of buying momentum. This pattern is generally formed after an uptrend, with the price creating three peaks at nearly the same level. This shows that buyers are unable to push the prices higher. But once the price breaks below the support level, it confirms that a potential trend reversal from upward to downward. This article explains triple top chart pattern meaning, how to identify it, and more.
Note: Refer this Image as we need to create image like this.
How to Identify a Triple Top Pattern?
Traders can easily identify the triple top chart pattern by following the points given below:
- Prior Uptrend: The triple top pattern is formed after a sustained upward price movement. These uptrend movements show that there is a strong buying interest. But with repeated failures at the resistance level, it signals a weak momentum and a potential reversal.
- Three Peaks at Resistance: The price reaches a similar resistance level three times but fails to break above it. This also shows that the selling pressure consistently outweighs buying interest.
- Pullbacks Between Peaks: After each peak, the price declines to a support level, forming a visible range. These repeated pullbacks also helps in establishing a clear support level.
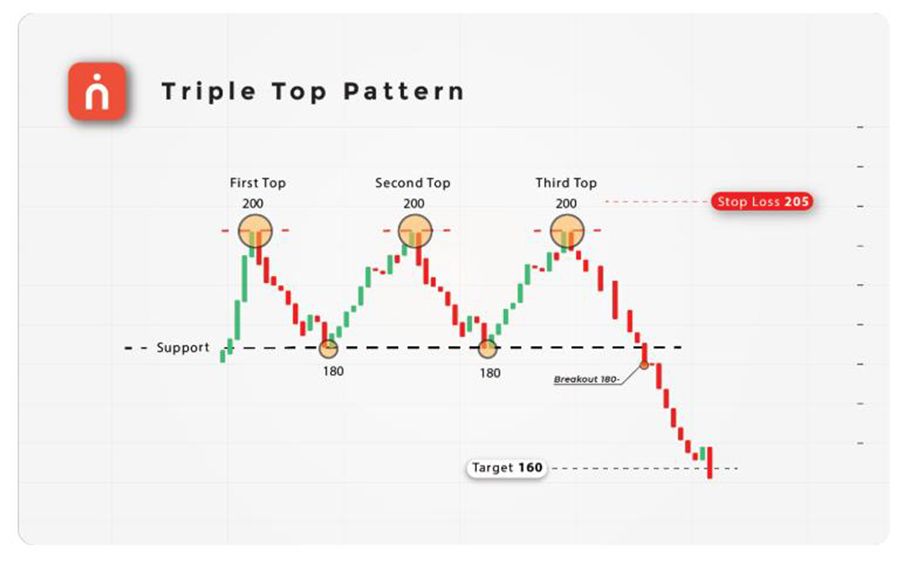
- Formation of Neckline (Support): A horizontal support line is formed by connecting the lows between the peaks. This formation is called the neckline support formation.
- Breakdown Confirmation: The pattern is confirmed when the price breaks below the support (neckline) with increased volume.
Example: Suppose a stock rises to ₹500 and falls to ₹470, then again rises to ₹500 and falls back, and repeats this for the third time. If the price finally breaks below ₹470 with strong volume, it confirms a triple top chart pattern, indicating a potential downward trend.
Note: Refer this Image as we need to create image like this.
How to Use Triple Top Pattern in Trading?
Here’s how the triple top pattern can be used in trading.
- Volume Check: Ensure the breakdown is supported by higher trading volume for confirmation. It can also act as a strength indicator. If the volume is higher, then it simply confirms the selling pressure.
- Stop-Loss Placement: Place a stop-loss slightly above the resistance level (top of the pattern). It protects investors from risk, as it helps limit the potential losses.
- Target Price: Estimate the target by measuring the height between resistance and support, then subtracting it from the breakdown point. This provides a logical price target.
- Avoid Early Entry: Do not trade before confirmation, as the pattern may fail without a proper breakdown. It reduces the chances of wrong entries.
Characteristics of Triple Top Pattern
The following are the key characteristics of triple top pattern:
- Three Similar Highs: The price reaches nearly the same level three times, forming three peaks. This shows that the resistance level is strong and buyers are unable to push the price higher despite repeated attempts.
- Neckline (Support Level): A support line is formed by joining the lows between the peaks. When the price breaks below this level, it confirms the pattern and indicates a possible downward movement.
- Volume Behaviour: Trading volume usually declines as the pattern develops and then rises sharply during the breakdown, supporting the bearish signal.
- Pattern Structure: The overall formation creates a clear structure with three tops and a flat support level, reflecting repeated rejection at resistance and building selling pressure.
Advantages and Disadvantages of Triple Top Pattern
The table below shows the advantages and disadvantages of triple top chart pattern:
Metric | Advantages | Disadvantages |
| Trend Signal | Clearly indicates a potential bearish reversal after an uptrend. | May give false signals if the breakdown is not properly confirmed. |
| Ease of Identification | Easy to recognise due to three clear peaks at a similar level. | Can sometimes be confused with other patterns like a double top. |
| Entry Opportunity | Provides a clear signal for short-selling after support breaks. | Entering late after breakdown may reduce profit potential. |
| Risk Management | Allows traders to place a defined stop-loss above resistance. | Losses can increase if the pattern fails and price reverses. |
| Volume Confirmation | Volume increase during breakdown adds strength to the signal. | Volume signals are not always consistent or reliable. |
| Target Calculation | Helps estimate price targets using the pattern height method. | Actual price may not always reach the expected target level. |

- BlinkX launches ItsATraderThing Campaign
- blinkX Introduces 'Options Watchlist' to Empower Traders with Real-Time Insights
- BlinkX Enhances Trading with 24/7 Customer Support Capabilities
- Unlocking Seamless Trading: Introducing “Order Slicing” For The FnO Market
- A Game-Changer for Traders: Introducing Horizontal Watchlists
FAQs on Triple Top Pattern
What is the meaning of the triple top pattern?
A triple top pattern is the bearish reversal chart patter which develops when the price goes up and tries to break through a resistance line three times but fails. It shows a decrease in purchasing strength and also a possible transition to the decreasing trend.
Is the triple top pattern bullish in nature?
No, it is not the triple top pattern which is bullish. It is a downward trend indicating that there is a potential turnaround of an upward direction into a downward direction particularly when the price falls below the price support level.
How accurate is the triple top pattern?
The triple top is a pattern that is believed to be moderately accurate, provided that a strong volume is supported during the breakdown. Yet, similar to any technical pattern, it is not quite correct and is to be combined with other indicators to form a more confirmed picture.
How can I trade a triple top pattern?
Traders typically enter a sell or short position after the price breaks below the support (neckline). A stop-loss is placed above the resistance level, and the target is estimated based on the height of the pattern.
What is the time horizon of the triple top chart?
The time horizon of a triple top pattern can vary depending on the chart timeframe. It may form over a few days in short-term charts or several weeks to months in long-term charts, making it applicable for both short-term and positional trading.