What is a Rising Wedge Pattern? Meaning, Formation & Trading Strategy
- ▶<span lang="EN-US" dir="ltr"><strong>Characteristics of a Rising Wedge Pattern</strong></span>
- ▶<span lang="EN-US" dir="ltr"><strong>How Does a Rising Wedge Pattern Form?</strong></span>
- ▶<span lang="EN-US" dir="ltr"><strong>What Does a Rising Wedge Pattern Indicate?</strong></span>
- ▶<span lang="EN-US" dir="ltr"><strong>Rising Wedge Pattern vs Falling Wedge Pattern</strong></span>
- ▶<span lang="EN-US" dir="ltr"><strong>How to Trade the Rising Wedge Pattern?</strong></span>
- ▶<span lang="EN-US" dir="ltr"><strong>Volume Analysis in Rising Wedge Pattern</strong></span>
- ▶<span lang="EN-US" dir="ltr"><strong>Advantages & Disadvantage of Using Rising Wedge Pattern</strong></span>
- ▶<span lang="EN-US" dir="ltr"><strong>Conclusion</strong></span>
The rising wedge pattern constitutes a bearish reversal formation within technical analysis. It emerges during uptrends as prices establish higher highs and higher lows between two converging upward-sloping trendlines. In technical analysis, traders watch this pattern because it often shows that buying pressure is weakening. Many market participants track the breakout below the lower trendline to plan potential short trades or exit positions. This article explains everything one needs to know about the rising wedge chart pattern.
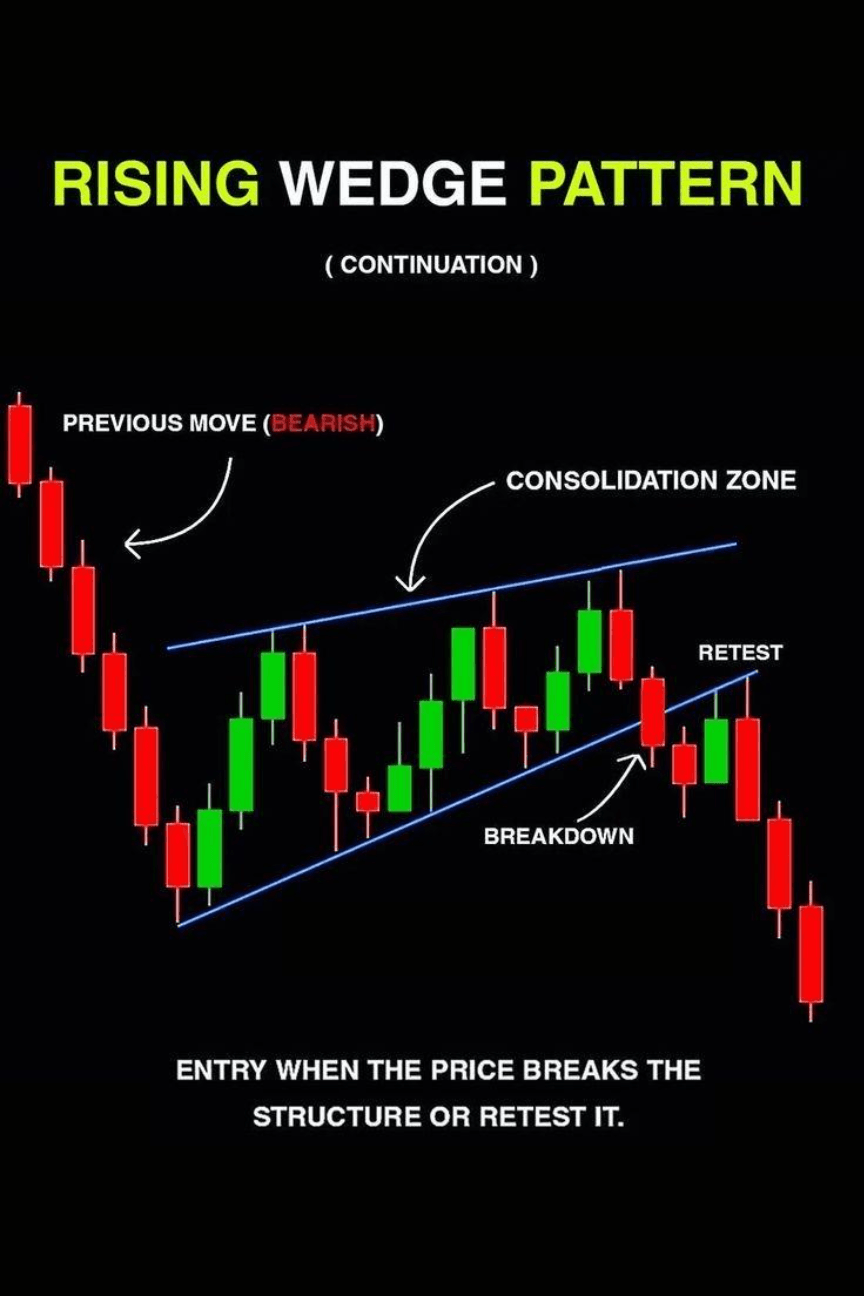
Refer Image – BlinkX Teams needs to add similar kind off image
Characteristics of a Rising Wedge Pattern
The characteristics of a rising wedge chart pattern are as follows:
- Higher highs and higher lows develop between two upward-sloping trendlines.
- The upper trendline exhibits a steeper incline than the lower trendline, resulting in convergence.
- The price range contracts over time, denoting diminished volatility.
- Volume diminishes as the pattern progresses, indicating buyer exhaustion.
- The breakout typically passes downward through the lower trendline.
How Does a Rising Wedge Pattern Form?
Here is how a rising wedge candlestick pattern forms
- An established uptrend generates initial higher highs and higher lows.
- The upper trendline connects swing highs, while the lower trendline links swing lows, both ascending.
- The interval between trendlines diminishes as subsequent highs advance more gradually.
- Candlestick bodies contract near the apex, accompanied by reduced volume.
- The pattern confirms when prices close below the lower trendline on elevated volume.
What Does a Rising Wedge Pattern Indicate?
Here is what a rising wedge candlestick pattern indicates
- Uptrend Begins Strongly
rice starts moving upward with steady buying pressure and well-formed higher highs and higher lows. At this stage, market sentiment still appears positive, and most participants expect the upward move to continue without major interruption. - First Series of Higher Highs and Higher Lows Appears
The market continues to rise and maintains an upward trend. However, careful observation shows that each new high forms with slightly less momentum than before. The trend remains intact, but early signs of slowing strength begin to appear. - Trendlines Start Converging
As the pattern develops, the rising support line begins to climb faster than the resistance line. This causes the price swings to compress within a narrowing range. The converging structure is one of the earliest visual warnings that momentum is no longer expanding. - Momentum Weakens Gradually
Even though price continues making higher highs, the upward pushes become shorter and less forceful. Candles may begin showing smaller bodies or longer upper wicks, reflecting growing hesitation among buyers. - Volume Usually Contracts
Trading activity often starts declining as the wedge matures. Lower volume during rising prices suggests that fewer participants are willing to support the upward move, which increases the probability of a bearish outcome. - Breakdown Below Support Occurs
The pattern confirms when the price closes decisively below the rising support line. This breakdown signals that sellers have started gaining short-term control, and the earlier upward structure has weakened. - Potential Bearish Move Follows
Once the breakdown occurs, the price may begin moving toward nearby support levels or prior demand zones. The follow-through strength usually depends on overall market conditions and volume behaviour during the breakdown.
Rising Wedge Pattern vs Falling Wedge Pattern
The following table highlights the difference between the rising wedge candlestick pattern and the falling pattern:
Feature | Rising Wedge Pattern | Falling Wedge Pattern |
| Trend direction | Forms during upward movement | Forms during downward movement |
| Slope of trendlines | Both trendlines slope upward | Both trendlines slope downward |
| Typical signal | Bearish bias | Bullish bias |
| Breakout direction | Usually downward | Usually upward |
| Market context | Weakening uptrend | Weakening downtrend |
| Trader expectation | Potential reversal lower | Potential reversal higher |
How to Trade the Rising Wedge Pattern?
Here is how one can trade the rising wedge pattern:
- Verify pattern integrity with trendlines intersecting at a minimum of two swing highs and lows, respectively.
- Await a conclusive close below the lower trendline supported by volume expansion.
- Initiate a short position upon a breakout candle close or unsuccessful retest of violated support.
- Establish a stop-loss above the most recent swing high or upper trendline.
- Calculate the profit objective by projecting the pattern height downward from the breakout level.
Volume Analysis in Rising Wedge Pattern
Volume constitutes critical validation for the rising wedge pattern. Initial upward progression reflects moderate volume, which subsequently contracts as trendlines converge, evidencing eroding buyer participation. The downside breakout coincides with volume resurgence, substantiating seller supremacy, and pattern fulfilment. Absence of such volume divergence compromises pattern credibility.
Advantages & Disadvantage of Using Rising Wedge Pattern
The advantages and disadvantages of using rising wedge patterns are as follows:
| Advantages | Disadvantages |
| Provides early warning of potential trend reversal | False breakdowns can occur volatile markets |
| Offers clear visual structure for chart analysis | Requires confirmation for higher reliability |
| Helps define logical stop-loss placement | Volume behaviour may not always follow textbook patterns |
| Supports structured risk management planning | Less effective in strongly trending bullish markets |
| Works across multiple timeframes and asset classes | Subjective trendline drawing can affect interpretation |
Conclusion
It highlights weakening buying momentum through converging trendlines and declining volume. Traders often use the breakdown to enter short positions with defined risk and reward levels. Proper volume confirmation and support analysis improve the effectiveness of this pattern. Additionally, a stock market trading app facilitates instantaneous surveillance and implementation of these configurations.
- BlinkX launches ItsATraderThing Campaign
- blinkX Introduces 'Options Watchlist' to Empower Traders with Real-Time Insights
- BlinkX Enhances Trading with 24/7 Customer Support Capabilities
- Unlocking Seamless Trading: Introducing “Order Slicing” For The FnO Market
- A Game-Changer for Traders: Introducing Horizontal Watchlists
FAQ on Rising Wedge Pattern
Is a rising wedge bullish or bearish?
The rising wedge pattern functions as a bearish reversal indicator. It often signals a potential downward move after the price breaks below support.
Are there other chart patterns like the rising wedge pattern?
Yes, there are alternative bearish configurations, including descending triangles and head-and-shoulders tops, which exhibit analogous reversal attributes.
What are the typical assets being traded with the rising wedge pattern?
Market participants usually utilise the rising wedge across equities, indices, currency pairs, and commodities spanning multiple venues.
What is the best time frame to use with the rising wedge pattern?
Daily and four-hour charts often provide clearer rising wedge formations with better signal quality.
How reliable are rising wedges?
Rising wedges exhibit approximately 70-80% efficacy for downward breakouts when accompanied by requisite volume validation.