Shooting Star Candlestick pattern
- ▶What is a Shooting Star Candlestick?
- ▶How to Identify the Shooting Star Pattern?
- ▶When does the Shooting Star Candlestick Pattern Occur?
- ▶How to Read Shooting Star Candlestick Pattern?
- ▶How to Trade Shooting Star Candles?
- ▶Pros & Cons of the Shooting Star Candlestick
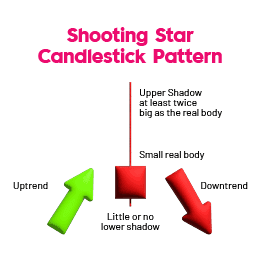
A shooting star candlestick is a price chart pattern that occurs when a security's price increases after opening and then falls close to the opening price before the market closes. It is characterised by a small body, long upper shadow or wick indicating price increase and buying pressure, and short lower shadow or wick indicating price drop. These patterns are used in technical analysis to predict upcoming bearish trends, with the decline in price signalling sellers' takeover.
Traders focus on three main points - finding the entry point, using stop-loss, and deciding on target profit. They wait for consecutive candlestick patterns to confirm price declines and consider options like selling or shorting if the pattern indicates a price drop. There are 35 candlestick patterns; hammer, morning star, inverted hammer, piercing pattern, shooting star, hanging man, and doji are the 7 most common candlestick patterns that you must know. But in this article we will understand shooting star candlestick in detail.
What is a Shooting Star Candlestick?
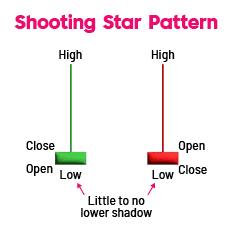
A Shooting Star Candlestick is a wide part of a security's price chart, representing the difference between the opening and closing prices. Its body is either green or red, with green indicating lower opening prices and red indicating higher opening prices. When reading a shooting star candlestick pattern, investors and traders must consider three aspects: the active price trend at the opening, the price drop in the latter half of the day, and the need to confirm the trend using candlesticks from the following days.
How to Identify the Shooting Star Pattern?
A shooting star is easy to spot on a chart. With a tall wick and a short body, this candle is in an uptrend or at a local high.
Step 1: Identifying the Highest
As a shooting star forms on the instrument's top, it is crucial to locate it first. Wait for a trend reversal and a breakthrough of the downtrend's bottom boundary if the pattern emerges during an upswing. A price reversal is most likely in this scenario.
Step 2: Outlining the Design
There are two candles in the pattern. The characteristics of a shooting star are as follows:
- The pattern is characterised by the existence of a small shooting star gap after the previous candle;
- The classic shooting star has a long upper shadow and a short body in the lower price range of the candle at the opening price level.
- The first candlestick must be bullish.
- The second candlestick can be bearish or bullish.
Step 3: The Trend Channel Breaks Out
Once the top and pattern have been identified, one must await evidence of a trend reversal. The market's move towards bearishness is confirmed by the retest and the breach of the ascending channel's bottom boundary.
When does the Shooting Star Candlestick Pattern Occur?
When the price of a securities rises sharply after opening and then quickly declines towards the market around an opening price, a shooting star candlestick pattern is formed. Candlestick designs with shooting stars indicate the conclusion of an upward trend and the beginning of a downward trend.
How to Read Shooting Star Candlestick Pattern?
A shooting star candlestick pattern is a technical analysis technique that involves three key factors. Firstly, investors and traders should observe the price advance, which occurs at the end of a bullish prior trend. This sharp price increase indicates a buying pressure for the past bullish period. As the number of buyers increases, the wick of the candlestick gets longer. Secondly, investors and traders should pay attention to the rapid price drop that occurs later in the day. This decline is caused by the increase in the number of sellers pushing the security price to a level close to the opening price for the day.
The long wick of the shooting star represents the sellers who took over the buyers over the day's progress. Lastly, to confirm a trend reversal, investors and traders should look for candlestick patterns that follow the shooting star pattern. These patterns depict a price decline with declining closing prices, and the trend is considered bearish only if the pattern following the shooting star also depicts a price drop. The accuracy and reliability of shooting star candlestick patterns depend on the candlestick patterns that follow the pattern.
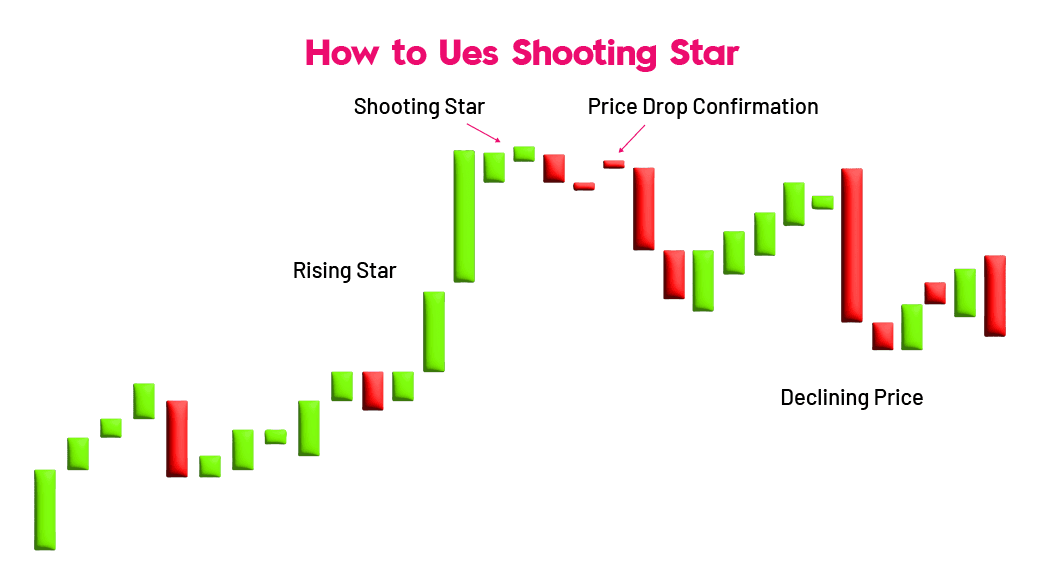
How to Trade Shooting Star Candles?
Below is a list of the three primary considerations that traders and investors should have in mind while using shooting star candlestick patterns, along with a price chart that illustrates the procedures that need to be followed.
- Entry Point
When trading with shooting star candlesticks, traders must decide on the entry point and check the active price trend. A shooting star occurs at the end of a bullish uptrend, and investors should enter only when the trend is bullish and the security price is increasing. To confirm the pattern, investors must identify a candlestick with a small body and long wick and wait for it to drop below the lowest price point.
- Stop-Loss Order
When trading with the shooting star candlestick pattern, it's crucial to use a stop-loss order. This pre-decided order allows a security to be bought or sold at a predetermined stop price, reducing losses and locking in profitable positions. It's advisable to place a stop-loss order above the upper wick to minimise losses and maximise returns.
- Set Profit Target
To trade with a shooting star candlestick pattern, decide on a price target that matches the length of the pattern. The minimum target should be three times the entire candlestick's length. Common trading methods include selling and shorting, with good returns achieved when the pattern forms after two or three consecutive highs. The ideal time to trade with this pattern is after two or three consecutive highs.
Pros & Cons of the Shooting Star Candlestick
Here are the pros and cons of the shooting star candlestick:
| Pros of Shooting Star Candlestick | Cons of Shooting Star Candlestick |
|---|---|
| Easy to Spot: Shooting stars have a distinct visual appearance with a small body and long upper wick, making them easy to identify on price charts. This is beneficial for beginners who are still learning candlestick patterns. | False Signals: Shooting stars are not perfect indicators and can sometimes produce false signals. The following candlesticks may not confirm the expected downtrend. |
| Easy to Understand: The concept behind the shooting star is straightforward. It suggests a potential reversal after a price increase, as sellers push prices down but are unable to sustain the move. | Needs Confirmation: A single shooting star shouldn't be the sole basis for a trading decision. Confirmation from other technical indicators or candlestick patterns is crucial to improve the reliability of the signal. |
| Useful for Predicting Downtrends: Shooting stars can indicate a potential shift in momentum from bullish to bearish. This can help traders anticipate and potentially profit from a price decline. | Not Standalone Indicator: For a more thorough knowledge of market sentiment, shooting stars should be utilised in conjunction with other technical analysis techniques. Strict adherence to this pattern may result in lost chances or needless losses. |
Conclusion
Although it's not ideal, a shooting star candlestick pattern may be a helpful predictor of market behaviour and should be used in conjunction with other indicators. It happens when the price of an asset is sharply pushed upward, only to be rejected and close to the open price. Aggressive traders can also use it as a sell signal, however additional indicators should be utilised to assess possible sell signals. It is best to hold off on acting on the signal until after you have had a day to check pricing and confirm it. At last, select a trustworthy share market software to begin your trading career!
- BlinkX launches ItsATraderThing Campaign
- blinkX Introduces 'Options Watchlist' to Empower Traders with Real-Time Insights
- BlinkX Enhances Trading with 24/7 Customer Support Capabilities
- Unlocking Seamless Trading: Introducing “Order Slicing” For The FnO Market
- A Game-Changer for Traders: Introducing Horizontal Watchlists
FAQs on Shooting Star Candlestick
What are the key characteristics of a shooting star pattern?
A shooting star candlestick pattern, a bearish candle with a long upper shadow, is a hammer candle turned upside down with a higher wick and equal open, low, and close levels.
How reliable is a shooting star pattern in predicting market trends?
Candlestick pattern with a long wick extends upside signals buyers can't follow higher moves, allowing sellers to initiate price change.
Is the shooting star pattern bullish?
A bearish candlestick with a lengthy upper shadow, little to no lower shadow, and a small actual body close to the day's low is known as a shooting star.
Are the shooting star and the hanging man the same?
A Shooting Star is an inverted Hanging Man. The shadows in both scenarios ought to be at least twice as tall as the subject. Both point to a possible decline in price.
What is the shooting star candlestick also known as?
A shooting star candlestick pattern, a bearish candle with a long upper shadow, is a hammer candle turned upside down with a higher wick and equal open, low, and close levels.