Inverted Hammer Candlestick Pattern
- ▶Inverted Hammer Meaning
- ▶When does the Inverted Hammer Candlestick Pattern Occur?
- ▶How to Identify Inverted Hammer Candlestick Pattern?
- ▶Advantages and Disadvantages of the Inverted Hammer Candlestick Pattern
When buyers push a stock's price upward, a reversal candlestick pattern known as the inverted Hammer candlestick pattern develops on the chart. It frequently shows up near the base of a downward trend, indicating a possible bullish turnaround. The pattern is an essential part of technical analysis used in stock market trading, and it takes its name from an actual inverted hammer.
By providing traders with useful information about the condition of the market, it assists traders in making judgements. It is easy to recognise an inverted hammer candle by its compact body, short bottom wick, and tall top wick. Let's take a closer look at the inverted hammer meaning and how to identify inverted hammer in this article.
Inverted Hammer Meaning
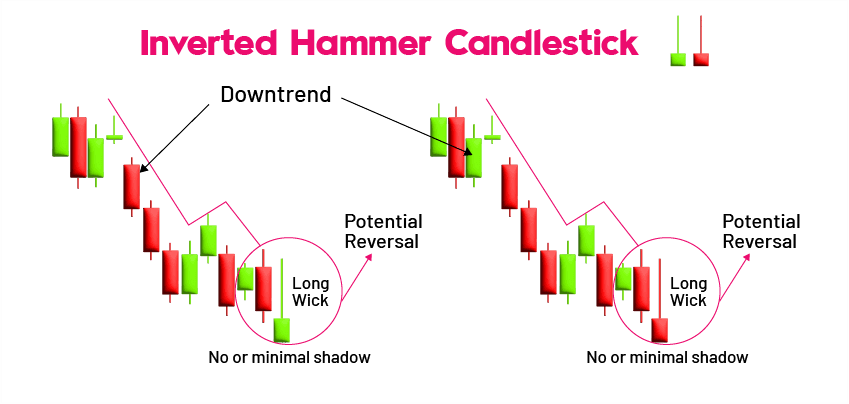
Inverted Hammer meaning is when buyers are pressuring an asset's price higher, a candlestick pattern which is also known as the inverse hammer, emerges on the chart. It usually appears around the bottom of a declining trend, suggesting a potential bullish reversal candlestick pattern.
The shape of the inverted hammer pattern in stock market is named after an upside-down hammer. An inverted hammer candle may be recognised by its small body, short lower wick, and tall top wick.
When does the Inverted Hammer Candlestick Pattern Occur?
The Inverted Hammer candlestick pattern, which is typically observed during a drop, denotes a change in market sentiment. The four main circumstances in which the Inverted Hammer Candlestick Pattern occurs are listed below.
- Bottom of a Downtrend: Frequently appears near the bottom of a downtrend, indicating a potential shift from a downtrend to bullish market sentiment.
- Support Levels: Often occurs near significant support levels on the price chart, acting as barriers for buyers to emerge and defend against further downward movement.
- Reduced Selling Pressure: This pattern emerges when selling pressure becomes less strong, perhaps resulting in a trend reversal.
- Enhanced Buying Interest: The pattern leads to higher trading volume, which suggests a stronger desire to purchase and raises the possibility of a positive reversal.
How to Identify Inverted Hammer Candlestick Pattern?
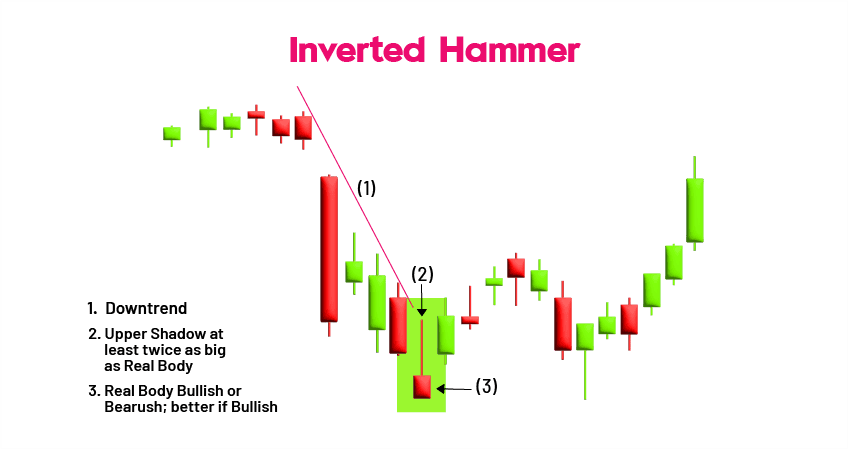
Technical analysis of the Inverted Hammer Candlestick Pattern entails comprehending its construction, assessing its importance, and taking into account other factors for confirmation.
- Identify the Inverted Hammer pattern in stock market on its price charts.
- Confirm the pattern to avoid false signals.
- Understand the structure of the pattern; The small body near the top of the range represents buying pressure, long upper shadow indicates selling pressure.
- Pay attention to trading volume as the pattern develops.
- Analyse price action to support the reversal.
- Monitor upward price movement to signal buyers' control.
- Manage risk by placing a stop-loss order below the low of the Inverted Hammer pattern in stock market.
Also Read: Inverted Hammer and Shooting Star
Advantages and Disadvantages of the Inverted Hammer Candlestick Pattern
Here are the advantages and disadvantages of the inverted hammer candlestick pattern:
| Advantages of Inverted Hammer | Disadvantages of Inverted Hammer |
| Acts as a reversal indicator, signalling a potential bullish reversal. | Generates false signals leading to losses. |
| Demonstrates change in market attitude from bearish to bullish. | Doesn't offer clear entry or exit points. |
| Can be confirmed with other indicators for increased potency. | Reliability varies with time frame and market conditions. |
| Applicable to multiple timescales and trading methods. | Requires subjective interpretation and may lead to disagreement. |
Conclusion
When anticipating market movements, an inverted hammer candlestick pattern may be a useful tool for turning bearish to bullish. It should be used in conjunction with other indicators, such as a trendline break or confirmation candle, to warn traders of impending market movements.
It is easier to determine market action and if it deviates from the trend by keeping an eye on this pattern for an extra trading day. It validates a fight between bulls and bears, with bulls using their purchasing power to surpass the bears.
- BlinkX launches ItsATraderThing Campaign
- blinkX Introduces 'Options Watchlist' to Empower Traders with Real-Time Insights
- BlinkX Enhances Trading with 24/7 Customer Support Capabilities
- Unlocking Seamless Trading: Introducing “Order Slicing” For The FnO Market
- A Game-Changer for Traders: Introducing Horizontal Watchlists
FAQs on Inverted Hammer Candlestick
Is a hammer bullish or bearish?
A bullish trading pattern known as the hammer candlestick indicates that a stock has reached a bottom and is about to see a trend reversal. It indicates that when sellers entered the market and pushed prices down, buyers finally outnumbered sellers and raised the asset's price.
What is the use of the inverted hammer?
Following a decline, the Inverted Hammer indicates a bullish turnaround. It signals to the traders that the stock is now willing to be purchased by bulls at the lower pricing.
What is the success rate of an inverted hammer?
The success rate of an Inverted Hammer varies but is generally around 60-70%. However, its effectiveness depends on confirmation signals, timeframe, market conditions, and proper risk management.
Are candlesticks with an inverted hammer dependable?
One of the most trustworthy candlestick patterns to show that price has hit its lowest point and will soon start rising again is the inverted hammer pattern, which is shaped like an inverted hammer.
What trading approach is known as the "inverted hammer"?
The session starts with the inverted hammer, as buyers seize the initiative and stop the current downward trend. However, sellers retake control and drive the market back towards openness.