What are Rectangle Patterns?
- ▶<span lang="EN-US" dir="ltr"><strong>How to Identify Rectangle Pattern?</strong></span><strong> </strong>
- ▶<span lang="EN-US" dir="ltr"><strong>Types of Rectangle Patterns</strong></span><strong> </strong>
- ▶<span lang="EN-US" dir="ltr"><strong>How to Trade Using Rectangle Patterns?</strong></span><strong> </strong>
- ▶<span lang="EN-US" dir="ltr"><strong>Benefits & Limitations of Using Rectangle Patterns</strong></span><strong> </strong>
- ▶<span lang="EN-US" dir="ltr"><strong>Conclusion</strong></span><strong> </strong>
Rectangle pattern refers to technical analysis chart patterns. In this pattern, the price of an asset moves within a horizontal rage. This range forms a clear support and resistance level, which further creates a rectangle-like structure on the chart. The rectangle chart pattern represents a period of consolidation in which both buyers and sellers stays in temporary balance. This causes the price to move sideways without a clear trend. This pattern is used by traders to easily identify the entry and exit points. This article explains what is a rectangle pattern, how to identify it, and more.

Note: Refer this Image as we need to create image like this.
How to Identify Rectangle Pattern?
Investors can easily identify the rectangle chart pattern by following the points given below:
- Spot Clear Support and Resistance Levels:
Investors need to first identify a price range where the asset repeatedly bounces between a lower support level and an upper resistance level. This will form a horizontal structure. - Look for Multiple Price Reactions:
To make sure that range is well established, investors need to ensure that the price touches both the support and resistance at least two times each. - Check for a Previous Trend:
Rectangle patterns often appear after an existing trend, indicating a pause before the trend potentially continues in the same direction. - Observe Sideways Price Movement:
During this phase, the price moves in a narrow range without forming higher highs or lower lows, showing consolidation. - Watch for Volume Behavior:
Trading volume may reduce during the consolidation phase and typically increases when the breakout occurs. - Confirm with a Breakout:
The pattern is validated only when the price breaks above resistance (bullish) or below support (bearish), preferably with strong volume support.
Example: Suppose a stock fluctuates between ₹200 and ₹230 over a period of time, touching both levels multiple times, it forms a rectangle pattern. A breakout above ₹230 may indicate a buying opportunity, while a fall below ₹200 may signal a selling opportunity.
Types of Rectangle Patterns
There are two main types of rectangle patterns:
Bullish Rectangle Pattern
A bullish rectangle pattern is generally formed during an existing uptrend when the price consolidates within a horizontal range before continuing upward. This pattern shows a temporary pause as buyers and sellers reach equilibrium. Here, but the overall market sentiment remains positive. A breakout above the resistance level confirms the bullish rectangle pattern. This pattern also signals a potential continuation of the uptrend, making it a buying opportunity for traders.

Note: Refer this Image as we need to create image like this.
Bearish Rectangle Pattern
Bearish rectangle pattern appears in a downtrend where the price moves sideways within a defined range. This happens before continuing its downward movement. This pattern shows a temporary consolidation phase where the selling pressure is still dominant despite short-term stability. A breakdown below the support level confirms the pattern and suggests further decline, often used by traders as a selling or shorting signal.
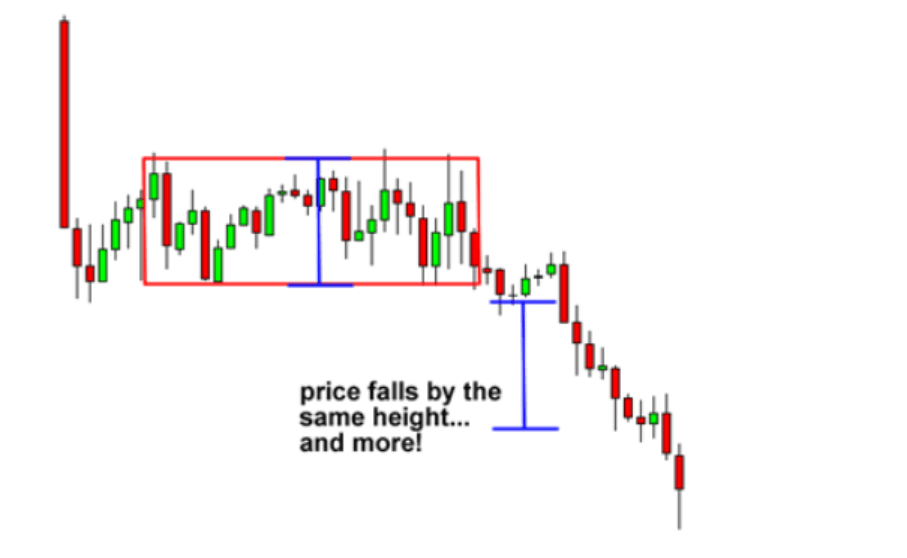
Note: Refer this Image as we need to create image like this.
How to Trade Using Rectangle Patterns?
To trade using the rectangle pattern the following steps need to be taken:
- Identify the Range Clearly
Investors need to first start by marking the support and resistance levels. These levels are important to be identified because here the price is consistently bouncing. This range forms the foundation of the trading setup. - Wait for Breakout Confirmation
Avoid entering trades within the range. Instead, wait for a clear breakout above resistance or below support, ideally supported by higher trading volume. - Plan Entry Points
Enter a buy trade when the price breaks above resistance, or initiate a sell/short trade when it falls below support. This helps align trades with the market direction. - Set Stop-Loss Levels
Place stop-loss orders just inside the rectangle range (below resistance for buy trades or above support for sell trades) to limit potential losses. - Determine Target Price
Measure the height of the rectangle and project it in the direction of the breakout to estimate the potential price target. - Manage Risk and Monitor Trade
Continuously track price movement after entry and adjust stop-loss levels if needed to protect profits and reduce risk exposure.
Benefits & Limitations of Using Rectangle Patterns
The table below shows the benefits and limitations of rectangle pattern:
Benefits of Using Rectangle Patterns | Limitations of Using Rectangle Patterns |
Rectangle patterns are easy to identify due to clearly defined horizontal support and resistance levels. | False patterns could be present in certain instances because the levels are not established well or not consistent. |
They offer easy exit and entry points depending on breakout levels which makes trade planning more organised. | Breakouts can be either false and temporary hence wrong trading decisions. |
The range allows traders to place stop-loss orders easily in order to manage possible losses. | Stop-loss levels can be initiated by sudden market volatility regardless of the overall trend. |
They can be implemented in different markets like stocks, forex and commodities and also in different time scales. | Effectiveness may vary depending on market conditions and liquidity. |
They often act as continuation patterns, helping traders align with the existing market trend. | Sometimes the pattern may act as a reversal instead of a continuation, causing confusion. |
They help in understanding consolidation phases and the balance between buyers and sellers. | The pattern does not indicate direction until a breakout occurs, which may delay decision-making. |
Conclusion
One of the most popular technical analysis tools that can assist traders to explain the times of market consolidation is the rectangle pattern. They underline the equilibrium between buyers and sellers and give clear support and resistance levels to make the decision. Traders will be able to design effective entry, exit and risk management strategies by identifying breakouts. Nonetheless, inaccuracy may be affected by market volatility and false breakouts; hence, confirmation is necessary. Knowledge of the rectangle patterns, along with the use of a reliable online trading app, can help in enhancing trading strategies and assist in making better investment choices in financial markets.
- What is Descending Triangle Chart Pattern?
- Taxation of Dividend Income in India: Rules, TDS & Everything Investors Need to Know
- Tax Saving Bonds India: A Smart Way to Grow Wealth
- Devolvement in Commodity Options: Meaning, Process, Margins & Settlement Explained
- Commodity Valuation: What It Is, How It Works, and Why It Matters
- BlinkX launches ItsATraderThing Campaign
- blinkX Introduces 'Options Watchlist' to Empower Traders with Real-Time Insights
- BlinkX Enhances Trading with 24/7 Customer Support Capabilities
- Unlocking Seamless Trading: Introducing “Order Slicing” For The FnO Market
- A Game-Changer for Traders: Introducing Horizontal Watchlists
FAQs on Rectangle Patterns
Is a rectangle pattern bullish or bearish?
A rectangle pattern can be both bullish or bearish depending on the breakout direction. An upward breakout signals bullish momentum, while a downward breakout indicates a bearish trend.
How to trade a rectangle pattern?
Traders wait for a breakout above resistance or below support before entering a trade. Stop-loss and target levels are set based on the rectangle range to manage risk.
What happens when a rectangle pattern is formed?
It indicates a consolidation phase where buyers and sellers are in balance. The price moves sideways until a breakout determines the next trend direction.
Is a rectangle pattern reliable?
Rectangle patterns are considered reliable when confirmed with volume and breakout strength. However, false breakouts can occur, so additional indicators are often used.
Which time frame is best for rectangle patterns?
Rectangle patterns can be used across multiple time frames, from intraday to long-term charts. Higher time frames generally provide more reliable signals.