What is the Average Directional Index (ADX)?
- ▶<span lang="EN-US" dir="ltr"><strong>How Does Average Directional Index Indicator Work?</strong></span><strong> </strong>
- ▶<span lang="EN-US" dir="ltr"><strong>Average Directional Index (ADX) Formula</strong></span><strong> </strong>
- ▶<span lang="EN-US" dir="ltr"><strong>How to use the ADX Indicator</strong></span><strong> </strong>
- ▶<span lang="EN-US" dir="ltr"><strong>Advantages and Disadvantages of the ADX Indicator</strong></span><strong> </strong>
- ▶<span lang="EN-US" dir="ltr"><strong>Using ADX in Trading Strategies</strong></span><strong> </strong>
- ▶<span lang="EN-US" dir="ltr"><strong>Conclusion </strong></span><strong> </strong>
Average Directional Index (ADX) is a famous technical tool used by traders to determine the strength of a price trend. Welles Wilder has developed it and the average directional index ADX is a part of a broader system called the Directional Movement System. In ADX there are three separate lines, which are used to understand if a trade should be taken for long or short, or if a trade should be taken at all. In this blog we will explore everything about the average directional index, the average directional index formula, how it works, its advantages, disadvantages and a lot more.
Note: Refer this Image as we need to create image like this.
How Does Average Directional Index Indicator Work?
Below is a simple step-by-step process on how the average directional index works:
- The ADX refers to a technical indicator that is used to calculate the overall strength of a market trend.
- The direction of the trend is not indicated in this trend, but it just indicates if it is a strong or weak trend.
- The range of ADX is generally between 0 and 100.
- If ADX is below 20, it is generally indicating a weak trend or a sideways trend in the market.
- When ADX is greater than 25, it implies that a strong trend is being developed in the market.
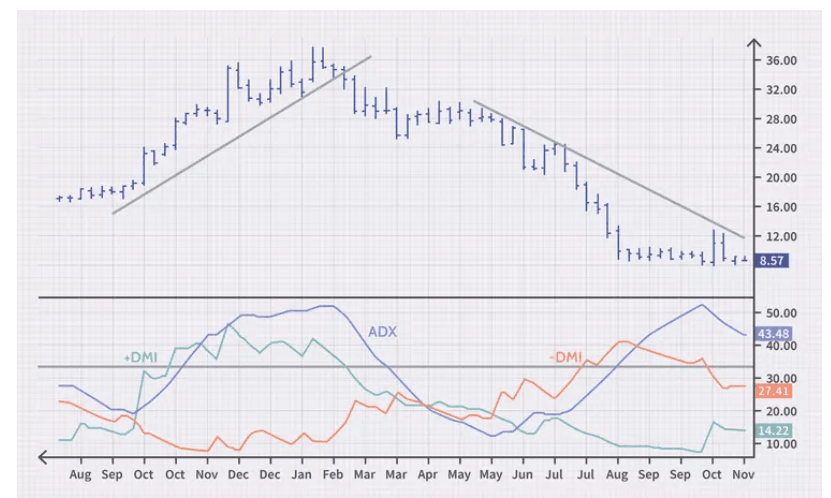
- It is normally used in combination with +DI (Positive Directional Indicator) and -DI (Negative Directional Indicator).
- When +DI crosses above –DI, then it may signal a potential upward trend.
- When –DI crosses above +DI, then it may indicate a possible downward trend.
- Traders use the ADX indicator formula, to confirm if a trend is strong enough to enter or continue a trade.
Example: If a stock price is steadily rising and the ADX value moves from 18 to 30. This increase suggests that the strength of the upward trend is improving. If the +DI line is also above the –DI line, traders may consider it a confirmation of a strong bullish trend.
Note: Refer this Image as we need to create image like this.
Average Directional Index (ADX) Formula
The ADX indicator is calculated using directional movement values and a smoothed average. The average directional index formula is:
ADX = Smoothed Moving Average of Directional Movement Index (DX)
Where:
- DX = (| +DI – –DI | ÷ ( +DI + –DI )) × 100
Explanation of the Formula:
- +DI (Positive Directional Indicator): Measures the strength of upward price movement.
- –DI (Negative Directional Indicator): Measures the strength of downward price movement.
- DX (Directional Index): Shows the difference between the positive and negative directional indicators.
- ADX: The smoothed average of DX values over a selected period, commonly 14 periods.
Here is an example of the calculation:
Assume the following values:
- +DI = 30
- –DI = 20
Step 1: Calculate the difference, |30 − 20| = 10
Step 2: Add the indicators, 30 + 20 = 50
Step 3: Use the ADX formula, DX = (10 ÷ 50) × 100
DX = 20
Step 4: Lastly, ADX is computed by using a smooth average of the DX over a specified number of time periods, which is usually 14. This is used to determine the strength of the trend in the market.
How to use the ADX Indicator
Following are the ways to use the average directional index ADX:
- Identify the trend strength: ADX helps traders understand when the market is trending. If the ADX values above 25 then it indicates a strong trend and if it values below 20 then it shows a weak trend.
- Confirms entry and exit points: To identify the buy and sell signals investors can look for crossovers between +DI and -DI. A crossover of +DI above -DI suggests a buying opportunity, while a crossover of -DI above +DI indicates a selling opportunity.
- Avoid trading in non-trending markets: Investors should avoid following the trend strategies when the ADX is below 20 because at this time the market doesn’t have a clear direction.
- Use ADX with other indicators: Combining the ADX with other indicators like RSI or Moving Averages can provide more reliable information.
After understanding how to use ADX indicator, the article further explains the advantages and disadvantages of the average directional index indicator.
Advantages and Disadvantages of the ADX Indicator
The following are the advantages and disadvantages of the average directional index indicator.
Advantages of the ADX Indicator | Disadvantages of the ADX Indicator |
| By using the average directional index traders can easily identify the strength of a trend and the potential for a trend reversal. | Through ADX, false signals can also be generated which might lead traders to loss. |
| Traders can use the ADX to know about the entry and exit points for a trade. | The average directional index ADX, can be complex for beginners to understand. |
| The ADX can be used to identify the potential of overbought or oversold levels in the market. | The information provided by ADX is very limited and it does not provide any information about how long it is likely to last. |
After understanding the ADX meaning, the article further explains how to use ADX in trading strategies.
Using ADX in Trading Strategies
The following are some ways to use ADX in the trading strategies.
Identifying Strong Trends
The traders widely use the Average Directional Index (ADX) to establish the strength of a trend in a market. Once the ADX value exceeds 25, then it is a typical indication that the market is in the good trend. During this stage, traders usually seek opportunities to trade since good trends can last longer. When the value of the ADX is less than 20, it normally indicates that the market is moving sideways and has a weak momentum.
Combining ADX with +DI and –DI Indicators
ADX is usually combined with Positive Directional Indicator ( +DI ) and Negative Directional Indicator ( -DI ). The line of the +DI crossing the -DI line is an indicator of a possible bullish trend. Conversely, it can be a bearish trend when the -DI line crosses over the +DI line. These crossovers are used to determine potential buy or sell signals by traders.
Filtering False Signals
ADX indicator may be used to filter weak signals in other technical indicators by traders. In order to demonstrate this, a trade may be indicated by a moving average or a breakout pattern but the traded of ADX is so low that traders may not enter the trade as the strength of the trend is very low. This will curb the risks of trading under uncertain conditions in the market.
Confirming Breakouts
The traders usually rely on ADX in order to verify price breakouts. When the price has broken and the ADX value begins to go up above the resistance level, then it could be that the breakout is being backed by good momentum. This assurance gives the traders more confidence to get into the trade.
Conclusion
To measure the strength of a market trend, the Average Directional Index can be a powerful tool. The tool doesn’t mention the direction of a trend but it provides useful information on whether the market is trending strongly or weakly. Traders can make great decisions by combining the tool with other tools and strategies. However, it is best to use this tool as a part of a comprehensive trading plan rather than its own. Additionally, traders can use a share market app to make more informed decisions and to track all their trading strategies.
- BlinkX launches ItsATraderThing Campaign
- blinkX Introduces 'Options Watchlist' to Empower Traders with Real-Time Insights
- BlinkX Enhances Trading with 24/7 Customer Support Capabilities
- Unlocking Seamless Trading: Introducing “Order Slicing” For The FnO Market
- A Game-Changer for Traders: Introducing Horizontal Watchlists
FAQs on Average Directional Index Indicator
Is ADX a Good Indicator?
Yes, ADX is a reliable indicator for measuring the strength of a trend, helping traders identify strong or weak trends.
What is a good average directional index?
An ADX value above 25 typically signals a strong trend, while values below 20 indicate a weak trend.
What is the difference between Aroon and ADX?
Aroon identifies the timing of trends, while ADX measures the strength of the trend without considering its direction.
What is the difference between RSI and ADX?
RSI measures the speed and change of price movements to identify overbought or oversold conditions, while ADX focuses on trend strength.
What is the preferred time frame for the ADX indicator?
The preferred time frame for the ADX indicator is a 14-period time frame. Using a 14-period time frame for the ADX indicator allows the user to measure the trend’s strength over the last 14 price periods.