What is Moving Average?
- ▶<span lang="EN-US" dir="ltr"><strong>How Does a Moving Average Work?</strong></span><strong> </strong>
- ▶<span lang="EN-US" dir="ltr"><strong>How to Use a Moving Average?</strong></span><strong> </strong>
- ▶<span lang="EN-US" dir="ltr"><strong>Advantages and Disadvantages of Moving Average in Intraday</strong></span><strong> </strong>
- ▶<span lang="EN-US" dir="ltr"><strong>Types of Moving Averages</strong></span><strong> </strong>
- ▶<span lang="EN-US" dir="ltr"><strong>Difference Between SMA, EMA, and WMA Moving Averages</strong></span><strong> </strong>
- ▶<span lang="EN-US" dir="ltr"><strong>Moving Average Trading Strategies</strong></span><strong> </strong>
- ▶<span lang="EN-US" dir="ltr"><strong>Conclusion</strong></span><strong> </strong>
A moving average (MA) is a technical analysis tool that calculates the average price value of a stock or asset over a specified period. The moving average indicator analysis tool provides traders with an opportunity to see the general direction in which prices are moving. It helps traders track market trends and identify if prices are moving up, down, or sideways. This tool can be used to identify entry and exit points. When applied to price charts, it helps in understanding trend behaviour and market momentum, which supports improved trading decisions and helps traders analyse price patterns clearly. This article explains the moving average indicator meaning by explaining how they work, and how traders use them in market analysis and more.
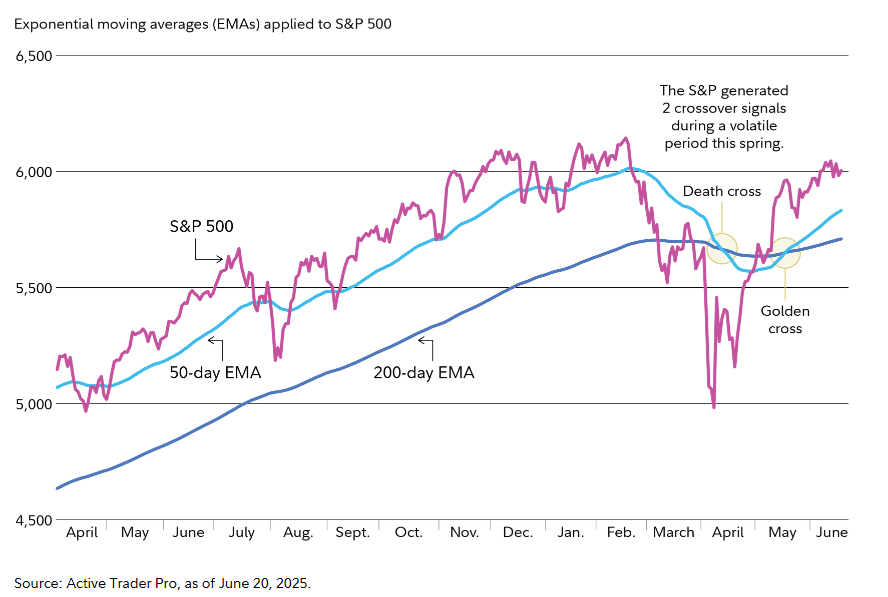
Note: Refer this Image as we need to create image like this.
How Does a Moving Average Work?
A moving average follows a simple process that helps traders observe how prices change over time. It is computed using a moving average formula, which calculates the average price values over a specified number of periods.
- A moving average is a calculation of the average price of an asset over a specified number of periods, including days, hours, and minutes.
- As the price values are updated, the oldest price value is removed, and the latest price value is added.
- This helps in smoothing the price movements and hence helps in identifying the trend.
- The price value is compared with the moving average value.
- If the price value is above the moving average value, it may indicate an upward trend. If the price value is below the moving average value, it may indicate a falling trend.
Example:
Assume a trader studies a 5-day moving average of a stock. If the closing prices for five days are ₹102, ₹104, ₹103, ₹105, and ₹106, the average becomes ₹104. On the next day, if the closing price is ₹107, the first value (₹102) is removed, and the latest five prices are used to calculate the new moving average.
How to Use a Moving Average?
The following points explain how traders commonly apply moving averages while studying moving average in stock market.
- Select a time period such as a 20-day, 50-day, or 200-day moving average.
- Plot the moving average line on the asset’s price chart.
- Compare the price movement with the moving average line to identify the market trend.
- Use it to notice support and resistance levels where prices may react.
- Apply two moving averages together to identify possible crossover signals.
Combine moving averages with other indicators to support trading decisions.
Advantages and Disadvantages of Moving Average in Intraday
Here are some of the advantages and disadvantages of moving average indicator in intraday trading.
Advantages of Moving Average | Disadvantages of Moving Average |
| Helps in identifying and understanding market trends. | Inability to adapt to unique price histories of different assets. |
| Acts as a support system by aiding in determining potential price support. | Inability to predict future values when securities lack clear trends. |
| Assists in measuring momentum and gauging direction and strength. | Inability to interpret cyclical behavioural patterns in stocks. |
| Provides insight into trends but may not always predict accurately. | Complexity in adjusting moving averages across various time frames. |
Types of Moving Averages
Moving average indicator come in a variety of types, each with distinctive characteristics and uses. Let's explore the most common types of moving averages in detail.
Simple Moving Average (SMA)
The Simple Moving Average in intraday trading is the most basic and widely used type of moving average. It calculates the average price over a specified period by summing up the prices and dividing them by the number of periods. For example, a 10-day SMA calculates the average price over the past 10 trading days. The SMA treats each period equally and provides a straightforward representation of the price trend. The formula below is used to calculate the SMA.
Simple Moving Average = (P1+P2 + ... + Pn) ÷ n
Exponential Moving Average (EMA)
While calculating the EMA, more weightage is given to the most recent prices, with older prices gradually receiving less influence. This weighting mechanism enables EMAs to react more quickly to price changes compared to SMAs. Traders often prefer EMAs for short-term analysis and trend identification. The formula below is used to calculate the EMA.
Current EMA = [Closing Price of the Stock - EMA (Previous Time Period)] x Multiplier + EMA (Previous Time Period)
Weighted Moving Average (WMA)
The Weighted Moving Average assigns different weights to each data point within the selected time period. Instead of giving equal weight to each price point, the WMA assigns higher weights to recent prices. The weighting scheme follows a predetermined formula, such as a linear or exponential progression. WMAs are known for their ability to respond quickly to price changes and are particularly useful in volatile markets. However, calculating WMAs can be more complex than SMAs or EMAs.
Double Exponential Moving Average (DEMA)
Although it reduces the latency usually associated with the exponential moving average and is more successful at smoothing out volatile price fluctuations, the double exponential moving average is still based on the same principles as the exponential moving average. The formula below is used to calculate the DEMA.
DEMA = 2 X EMA - EMA of EMAn
Triple Exponential Moving Average (TEMA)
Compared to the DEMA, the triple exponential moving average decreases latency and improves price action clarity. It is calculated using the following formula.
TEMA = (3 X ΕΜΑ₁) - (3 X EMA2) + EMA3
Difference Between SMA, EMA, and WMA Moving Averages
| Aspect | Simple Moving Average (SMA) | Exponential Moving Average ( EMA ) | Weighted Moving Average (WMA) |
| Calculation | Calculates the average price over a specified period. | Calculates the average price using a weighted smoothing factor | Calculates the average price using a weighted scheme. |
| Weighting Scheme | Assigns equal weight to all data points. | Assigns more weight to recent data points. | Assigns different weights to data points. |
| Responsiveness | Slower to react to recent price changes. | More responsive to recent price changes. | It can be adjusted to respond to different market conditions. |
| Lagging Effect | More prone to lag behind rapidly changing prices. | Less prone to lag and reflects current market conditions. | Depends on the specific weighting scheme used. |
Moving Average Trading Strategies
Understanding the moving average meaning helps traders apply different strategies to study price trends and possible trading signals. The following approaches explain how moving averages are used in market analysis.
- Moving Average Crossover Strategy
This method uses two moving averages with different time periods. If there is an increase in the trend, the short-term moving average will cross over the longer-term moving average. If there is a decrease in the trend, the short-term moving average will go below the longer-term moving average. - Trend Following Strategy
In this strategy, traders observe how the price behaves in relation to a moving average. When prices remain above the moving average line for a period of time, it may indicate upward momentum. When prices stay below it, the trend may be downward.
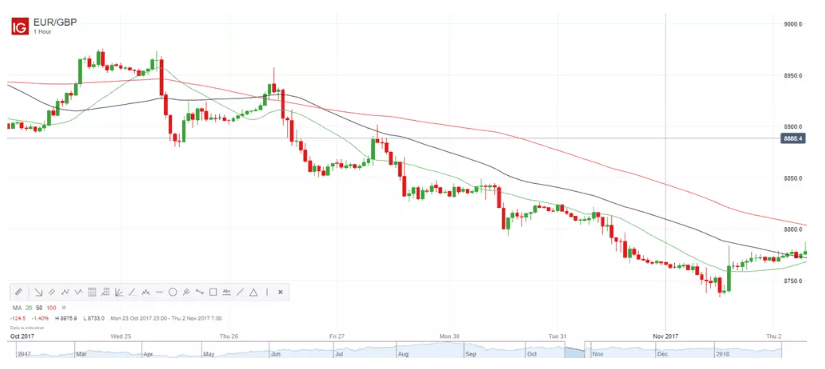
Note: Refer this Image as we need to create image like this.
- Support and Resistance Strategy
A moving average can sometimes act as a dynamic support or resistance level. During trending markets, prices may react near the moving average line before continuing in the direction of the trend. - Multiple Moving Average Strategy
Some traders apply several moving averages on the same chart to study short-term and long-term price behaviour. When multiple moving averages align in the same direction, it may suggest a stronger trend in the market.
Conclusion
The use of moving averages is quite common in the field of technical analysis. Moving averages are tools that assist traders in analysing the price movements. By analysing how prices interact with moving averages, traders may identify possible buying or selling opportunities. Moving averages are often studied along with other indicators to gain a clearer understanding of price behaviour. Many traders follow charts and indicators through an online trading app, which helps them track price trends and monitor moving averages during trading sessions.
- BlinkX launches ItsATraderThing Campaign
- blinkX Introduces 'Options Watchlist' to Empower Traders with Real-Time Insights
- BlinkX Enhances Trading with 24/7 Customer Support Capabilities
- Unlocking Seamless Trading: Introducing “Order Slicing” For The FnO Market
- A Game-Changer for Traders: Introducing Horizontal Watchlists
FAQs on Moving Average
What is a moving average in intraday trading?
A moving average in intraday trading is a statistical indicator that calculates the average price of a security over a specific time period. It provides a smoothed line that helps eliminate short-term fluctuations and offers insights into the underlying trend.
Can moving average be used for short-term trading?
Yes, moving averages can be used for short-term trading, including intraday trading.
Can moving averages be used for other types of trading, such as swing trading or long-term investing?
Yes, moving averages are versatile indicators and can be applied to various trading styles. Swing traders and long-term investors often use moving averages to identify major trends and potential reversal points
Should moving average in intraday trading be used alone or in combination with other indicators?
While moving average in intraday trading is a valuable indicator, it is generally recommended to use it in conjunction with other technical indicators and tools.
How to use Moving Average in intraday ?
Traders can use moving averages to determine entry and exit points based on price interactions with the moving average lines.