Falling Wedge Patterns
- ▶<span lang="EN-US" dir="ltr"><strong>How Do You Identify a Falling Wedge Pattern?</strong></span><strong> </strong>
- ▶<span lang="EN-US" dir="ltr"><strong>How Does a Falling Wedge Pattern Work?</strong></span><strong> </strong>
- ▶<span lang="EN-US" dir="ltr"><strong>Benefits and Drawbacks of Falling Wedge Patterns</strong></span><strong> </strong>
- ▶<span lang="EN-US" dir="ltr"><strong>A Falling Wedge Pattern Trading Strategy</strong></span><strong> </strong>
- ▶<span lang="EN-US" dir="ltr"><strong>Conclusion</strong></span><strong> </strong>
The falling wedge chart pattern is a bullish pattern. It is large at the top and narrows when the price starts to fall. The highs and lows of the price action meet up to generate a cone that slopes downward. This gives the appearance of a wedge when the lines approach a convergence. The wedge-shaped trend lines are considered useful indicators by technical analysts because they provide a potential reversal in price action. This blog explains the falling wedge pattern meaning, its construction in the share market, its significance, and the specialised technique for trading this pattern.
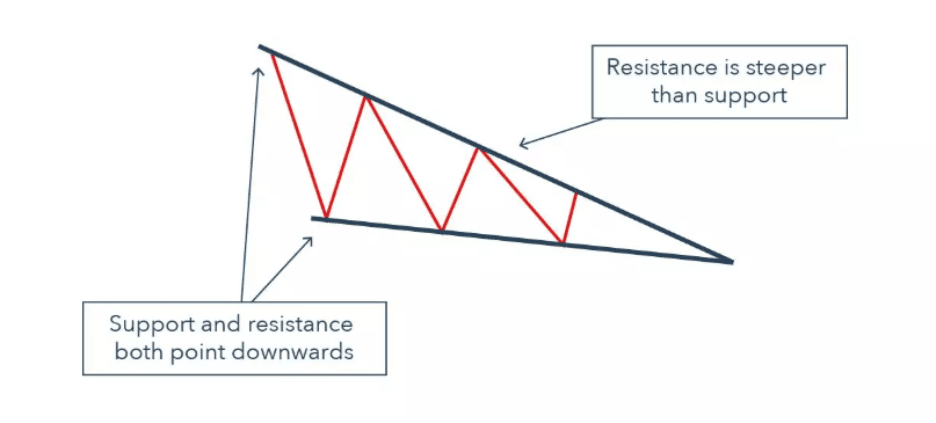
Note: Refer this Image as we need to create image like this.
How Do You Identify a Falling Wedge Pattern?
A falling wedge chart pattern can be recognised on a price chart by observing a few common signals.
- Start by determining whether the market is moving upward or downward. When the pattern forms during an uptrend, it may act as a continuation pattern. When it appears after a decline, it may signal a potential reversal.
- A falling wedge forms when two downward-sloping trendlines connect the price highs and lows. These lines gradually move closer and form the wedge shape.
- Traders often compare price movement with indicators such as the Relative Strength Index (RSI) or a stochastic oscillator. If price falls while the indicator starts rising, it may signal weakening selling pressure.
- Oscillators and other technical tools may indicate that the asset is in an oversold zone. This condition sometimes appears during the later stage of the wedge formation.
- A falling wedge is usually confirmed only when the price breaks above the upper trendline. Many traders wait for this breakout before considering a long trade.
How Does a Falling Wedge Pattern Work?
The falling wedge pattern follows a structured process that traders observe while analysing price movements.
- Development of the Pattern
A falling wedge takes shape when prices move within two downward-sloping lines that slowly come closer. Even though the market keeps forming lower highs and lower lows, the shrinking space between the lines shows that the downward move is losing strength. - Narrowing Price Range
During this stage, the distance between highs and lows reduces. This tightening movement reflects lower volatility and a phase where the market shows hesitation about continuing the decline. - Reduced Trading Activity
Trading activity often slows while the wedge forms. Lower volume during this period may suggest that the earlier selling momentum is gradually weakening. - Breakout Confirmation
The pattern is generally confirmed when the price moves above the upper trendline. A stronger breakout accompanied by higher trading activity may indicate that buyers are gaining control. - Possible Change or Continuation in Trend
The meaning of the breakout depends on the earlier trend. After a downtrend, it may signal a shift toward an upward move. If the wedge appears during an uptrend, the breakout can indicate that the earlier upward direction may continue.
Here’s a simple example that explains how falling wedge chart pattern generally works:
For instance, a stock may decline from ₹300 to ₹260 while forming narrowing downward trendlines. As the price swings become smaller, the stock eventually breaks above the upper trendline near ₹265. This move can suggest that the earlier downward pressure has eased and the price may begin moving upward.
Note: Refer this Image as we need to create image like this.
Benefits and Drawbacks of Falling Wedge Patterns
Technically speaking, a falling wedge chart pattern is positive and weakens the negative trend. It implies that the present trend will either last or change direction. It indicates that the phase of correction or consolidation is over. Buyers profit from market consolidation to open up new purchasing opportunities, outwit the bears, and raise prices.
Benefits of Falling Wedge Patterns | Drawbacks of Falling Wedge Patterns |
| Clear stop, entrance, and limit levels are presented. | Incorrectly recognised frequently. |
| Commonly occurs in the financial markets. | Inexperienced traders may find it unclear. |
| After missing the first advance (continuation scenario), traders might enter a trending market using the falling wedge pattern. | Additional technical indicators and oscillators are needed for further confirmation. |
| A chance to achieve positive risk-reward ratios | The falling wedge might represent a continuation or reversal pattern (accurate identification is crucial). |
A Falling Wedge Pattern Trading Strategy
Traders often follow a step-by-step approach when using the falling wedge chart pattern for trading decisions.
- Spot the Pattern
The first step is to confirm that the price is forming a proper falling wedge. A trader usually draws two downward-sloping trendlines that connect the lower highs and lower lows. The important part is that these lines gradually move closer together. This narrowing movement shows that the downward momentum is slowing. - Observe Price Behaviour and Indicators
Before taking any trade, many traders spend some time watching how the price behaves inside the wedge. They may also check indicators such as the Relative Strength Index (RSI) or stochastic oscillator. If the indicator starts moving upward while the price still declines, it can suggest that selling pressure is weakening. - Wait for Price Breakout
A common approach is to avoid entering the trade too early. Instead, traders wait for the price to break above the upper trendline of the wedge. This breakout often acts as the confirmation that buyers may be stepping in. - Select the Appropriate Entry Point
Once the breakout becomes visible on the chart, traders may consider entering a long position. Some prefer to wait for a candle to close above the trendline to reduce the chance of a false breakout. - Set a Stop-loss to Manage Risk
Risk control is an important part of the strategy. Many traders place the stop-loss slightly below the most recent swing low inside the wedge. This generally helps limit losses if the price suddenly moves in the opposite direction. - Define Target Price
One of the common ways to set a target price is by measuring the widest section of the wedge and projecting that distance upward from the breakout point. While this method does not assure the outcome, it does give traders a rough idea of where the price could move next.
Conclusion
A falling wedge pattern helps traders understand when selling pressure may be fading and a price rise could follow. The pattern forms with converging downward trendlines and usually completes when the price breaks above resistance. Many traders study this structure to find possible entry and exit points in the market. With chart analysis tools available on an online trading app, identifying patterns like the falling wedge becomes easier and helps traders monitor price behaviour more clearly.
- Understanding the Difference Between Shares and Mutual Funds
- The Difference Between Stock Split & Bonus: Understanding Key Distinctions
- What is an Inverted Hammer Candlestick Pattern?
- Difference Between Shareholder and Debenture Holder
- What is Interim Dividends? Its benefits & factor influencing interim dividends
- BlinkX launches ItsATraderThing Campaign
- blinkX Introduces 'Options Watchlist' to Empower Traders with Real-Time Insights
- BlinkX Enhances Trading with 24/7 Customer Support Capabilities
- Unlocking Seamless Trading: Introducing “Order Slicing” For The FnO Market
- A Game-Changer for Traders: Introducing Horizontal Watchlists
FAQs on Falling Wedge Pattern
What does a falling wedge pattern predict?
A falling wedge pattern predicts whether prices will continue declining or their downward momentum will change depending on where it appears.
Is a falling wedge pattern bullish?
The two variations of the wedge pattern are a rising wedge, which denotes a bearish turn, and a falling wedge, which denotes a bullish turn.
What is the duration of a falling wedge?
A Falling Wedge should preferably appear during a protracted decline at least three months old to be considered a reversal pattern. Over a three- to six-month period, the Falling Wedge pattern might appear on its own.
How is a falling wedge pattern measured?
This is calculated by adding the trend line breakout distance to the height of the rear of the wedge.
How can I accurately trade a falling wedge pattern?
To trade a falling wedge accurately, wait for a confirmed breakout above the resistance line with increased volume, then set a stop-loss below the recent low to manage risk.