What is an Inverted Hammer Candlestick Pattern?
- ▶<span lang="EN-IN" dir="ltr"><strong>Key Characteristics Inverted Hammer Candlestick Pattern</strong></span>
- ▶<span lang="EN-IN" dir="ltr"><strong>What Does the Inverted Hammer Indicate?</strong></span>
- ▶<strong>How to Trade Using the Inverted Hammer Pattern in Stock Market?</strong>
- ▶<span lang="EN-IN" dir="ltr"><strong>Inverted Hammer vs Shooting Star</strong></span>
- ▶<span lang="EN-IN" dir="ltr"><strong>Advantages & Disadvantages of the Inverted Hammer Candlestick Pattern</strong></span>
- ▶<span lang="EN-IN" dir="ltr"><strong>When is the Inverted Hammer Most Reliable?</strong></span>
- ▶<span lang="EN-IN" dir="ltr"><strong>Common Mistakes and Failure Signals</strong></span>
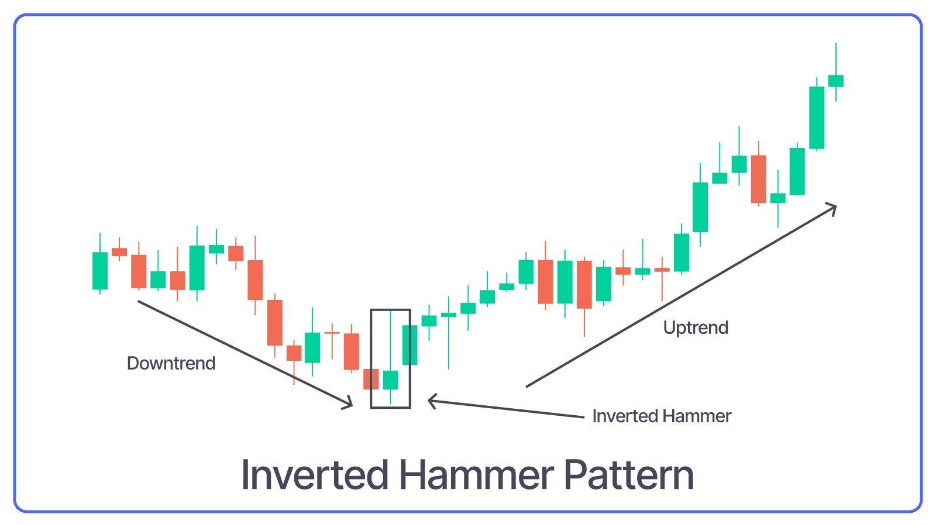
An inverted hammer pattern in stock market is a single-candle bullish reversal candlestick pattern that appears at the bottom of a downtrend. It is named as an ‘inverted hammer’ because it resembles an upside-down version of the hammer candlestick pattern. Technical analysts use this pattern to identify potential shifts in the market condition. An inverted hammer candlestick pattern is formed when the prices move higher during a trading session but close near the opening level. This shows that the buyers attempted to push prices up despite existing bearish sentiment. The inverted hammer candlestick pattern is explained in this article along with how it works, how to identify inverted hammer, and more.
Key Characteristics Inverted Hammer Candlestick Pattern
After understanding the inverted hammer candlestick meaning, let’s explore the key features. The following are the key characteristics of the inverted hammer candlestick pattern.
- Appears after a downtrend: The pattern is formed only after a sustained price decline, where the selling pressure is seen as dominant. This position in a downtrend is important, as it shows there is a potential shift in the momentum rather than a continuation.
- Small real body near the low: The candle has a small real body located close to the lower end of the trading range. This shows that the opening and closing prices are nearly the same and that bearish momentum is losing strength.
- Long upper shadow: The pattern has a prominent upper shadow, generally at least twice the length of the real body. This shows that the buyers attempted to push prices higher during the session, reflecting emerging buying interest.
- Very short or no lower shadow: The absence or minimal presence of a lower wick suggests limited further downside during that trading period, supporting the idea that selling pressure is easing.
- Bullish implication with confirmation: As the pattern shows potential reversal, it becomes more reliable when it is followed by a bullish confirmation candle. After understanding the inverted hammer candlestick pattern meaning and its key characteristics, let’s understand what this pattern indicates.
What Does the Inverted Hammer Indicate?
In how to identify inverted hammer, the inverted hammer candlestick meaning indicates the following situations:
- Early buying interest emerges
The pattern shows that the demand is going to decline because the buyers step in at lower price levels and push prices sharply higher. - Sellers attempt to regain control
Despite having an upward move, the sellers manage to pull prices back near the opening level by the close, indicating that bearish pressure is still present but no longer dominant. - Weakening selling pressure
The failure of sellers to drive prices to new lows suggests that downside momentum is losing strength and the market may be nearing exhaustion on the sell side. - Shift in market sentiment
Long upper shadow indicates a behavioural transformation which consists of aggressive selling to cautious selling and buyers are more active, which seems a hint of a potential shift in sentiment. - Probable bullish reversal motive
Inverted hammer is not a bullish indicator on its own but with the help of subsequent bullish candle, increased volume, or critical support levels, it increases the likelihood of a bullish reversal candlestick pattern.
Also Read: Difference Between Shooting Star and Inverted Hammer
How to Trade Using the Inverted Hammer Pattern in Stock Market?
Investors can trade using the inverted hammer candlestick pattern by following the steps given below.
- Identify a prior downtrend
Start by confirming that the inverted hammer candlestick pattern appears after a clear downtrend. Without a preceding decline, the pattern loses its reversal significance. - Wait for a confirmation candle
Do not enter a trade immediately after the inverted hammer forms. Look for a bullish confirmation candle in the next session, such as a strong green candle closing above the inverted hammer’s high, to validate buying strength. - Define the entry point
Enter a long position only after confirmation. A common approach is to place a buy order slightly above the high of the inverted hammer, ensuring that price is moving upward. - Set the stop-loss level
Place the stop-loss below the low of the inverted hammer. This level acts as a logical invalidation point, if price breaks below it, the reversal setup fails. - Determine target levels
Set profit targets using nearby resistance levels, previous swing highs, or key moving averages. Traders may also apply a risk–reward ratio of at least 1:2 to maintain disciplined trade management. - Use supporting indicators
Improve reliability by combining the inverted hammer candlestick pattern with volume expansion, RSI divergence, or support zones, which help confirm the strength of the potential bullish reversal candlestick pattern.
Inverted Hammer vs Shooting Star
The following are the differences between a hammer and a shooting star.
| Aspect | Inverted Hammer | Shooting Star |
| Market Trend | Appears after a downtrend | Appears after an uptrend |
| Signal Type | Potential bullish reversal | Potential bearish reversal |
| Candle Shape | Small real body near the lower end with a long upper wick | Small real body near the lower end with a long upper wick |
| Lower Shadow | Very small or absent | Very small or absent |
| Upper Shadow | Long upper shadow (at least 2× the body) | Long upper shadow (at least 2× the body) |
| Color of Candle | Can be bullish or bearish | Can be bullish or bearish |
| Market Psychology | Buyers attempted to push prices higher after a decline | Sellers pushed prices down after buyers failed to sustain higher levels |
| Confirmation Required | Yes, bullish confirmation in next candle | Yes, bearish confirmation in next candle |
Advantages & Disadvantages of the Inverted Hammer Candlestick Pattern
The table below shows the advantages and disadvantages of the inverted hammer candlestick pattern.
Advantages Inverted Hammer Candlestick Pattern | Disadvantages Inverted Hammer Candlestick Pattern |
Helps identify early signs of a bullish reversal after a downtrend | Not a standalone signal; requires confirmation from the next candle |
Simple single-candle pattern, easy to spot on price charts | Can give false signals in sideways or highly volatile markets |
Reflects weakening selling pressure and emerging buying interest | Does not indicate the exact strength or duration of the reversal |
Useful for low-risk entry planning with clear stop-loss placement | Less reliable if it forms away from support levels |
Works well when combined with volume, support, or indicators | Ineffective if the broader trend remains strongly bearish |
When is the Inverted Hammer Most Reliable?
The inverted hammer candlestick meaning is generally reliable in the following conditions:
- After a strong prior downtrend: The inverted hammer is effective when it appears after a clear and extended downtrend, as this context increases the probability of a genuine trend reversal rather than a short-term pause.
- Formation around important support areas: The more reliable ones are when the pattern is formed around major support areas like past swing lows, demand areas or long-term moving averages where buyers interest would come on board.
- High volume validation: When the volume increases when the hammer is inverted or when the confirmation candle, then the signal is strengthened and the buyers are actively involved and not performing a weak bounce.
- Bullish follow through candle: When a powerful bullish candle closes higher than the inverted high of the hammer, this is a confirmation of the control over the buyers and the confidence in the trade is hugely improved.
- Alignment with other indicators: The pattern performs better when supported by indicators such as RSI oversold conditions, bullish divergence, or momentum shifts, which validate the reversal intent.
Common Mistakes and Failure Signals
The following are some mistakes and failure signals that investors should keep in mind while following this pattern.
- Ignoring the prior trend: Treating an inverted hammer as a bullish signal without a preceding downtrend often leads to false interpretations.
- Entering without confirmation: Taking trades immediately after the inverted hammer forms, without waiting for a confirmation candle, increases the risk of failure.
- Low-volume formation: An inverted hammer formed on weak volume may reflect temporary price movement rather than genuine buying interest.
- Sideways or range-bound markets: In non-trending markets, the pattern frequently fails, as price action lacks the momentum needed for a sustained reversal.
- Poor stop-loss placement: Setting stop-loss levels too close or ignoring the candle’s low can result in premature exits or unmanaged risk.
Disclaimer: All investments are subject to market risks, economic conditions, regulatory changes, and other external factors. Returns are not guaranteed and may vary based on market performance and investment tenure. Investors should assess their risk tolerance and financial objectives, conduct their own research, and consult a qualified financial advisor before making any investment decisions.
Conclusion
An inverted hammer pattern in stock market is a technical indicator that could be useful in identifying the initial signs of a possible bullish reversal following a decline. Its usefulness is based on accurate identification, correct trend context, and the support by subsequent price action and volume. The pattern potentially could improve trade decision-making when used together with support levels, indicators, and sound risk management. Enforcing these principles every time on a trusted stock market trading app would assist traders in making the inverted hammer more precise and enhance overall trading results.
- BlinkX launches ItsATraderThing Campaign
- blinkX Introduces 'Options Watchlist' to Empower Traders with Real-Time Insights
- BlinkX Enhances Trading with 24/7 Customer Support Capabilities
- Unlocking Seamless Trading: Introducing “Order Slicing” For The FnO Market
- A Game-Changer for Traders: Introducing Horizontal Watchlists
FAQs on Inverted Hammer Candlestick Pattern
Is the inverted hammer bullish or bearish?
Inverted hammer candlesticks indicate a bullish reversal or a short-term reversal of a downtrend.
What is the psychology behind the inverted hammer pattern?
Inverted hammers signal a potential bullish reversal after downtrends. This indicates that bulls are now willing to purchase the stock at a lower price.
Which is a stronger hammer or an inverted hammer?
Hammers are stronger than inverted hammers because they close at the top of candles.
What is the difference between red and green inverted hammers?
Green or blooming inverted hammers occur during downtrends because of their long upper shadows. During an uptrend, it is called a red or fading inverted hammer because of its small body. A green inverted hammer indicates that the price made a lower low before closing higher than it did the previous day. The red inverted hammer indicates that prices closed lower than the previous day's closing price.
How effective is an inverted hammer?
Inverted hammers are supposed to be bullish reversal candles, but 65% of the time they're bearish continuation candles. Overall, it ranks 6 out of 103 candles, meaning that the trend after the candle is often significant.