What is Bull Flag Pattern?
- ▶<span lang="EN-US" dir="ltr"><strong>How to Identify a Bull Flag Pattern</strong></span><strong> </strong>
- ▶<span lang="EN-US" dir="ltr"><strong>How to Use Bull Flag Candlestick Pattern in Trading?</strong></span><strong> </strong>
- ▶<span lang="EN-US" dir="ltr"><strong>Benefits and Limitations of Bull Flag Pattern</strong></span><strong> </strong>
- ▶<span lang="EN-US" dir="ltr"><strong>Conclusion</strong></span><strong> </strong>
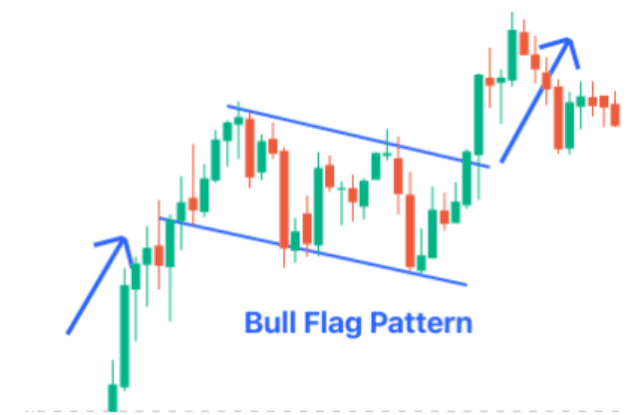
During a technical analysis, the bull flag pattern refers to a chart pattern that indicates that a temporary pause in an existing uptrend before the price continues to move higher. A bullish flag chart pattern is formed when there is a strong upward movement followed by a short consolidation phase where the prices move slightly downward or sideways. This creates a flag-like structure. A short-term profit booking is reflected by this pattern while the overall bullish sentiment remains the same. Many traders use this pattern to identify buying opportunities. This article explains what is bull flag pattern, how to identify it, and more.
Note: Refer this Image as we need to create image like this.
How to Identify a Bull Flag Pattern
It is easy to identify the bull flag pattern. Investors can identify this pattern by following the points given below:
- Strong Uptrend (Flagpole Formation): The trend starts with a high upward price movement which creates a steep rise called the flagpole.
- Consolidation Phase (Flag): The price action following the rally is a sideways or a slight downturn in a small range, which creates a small rectangular or falling channel.
- Low Volume During Consolidation: The trading volume during the flag tends to decrease and means that there is a rest and not a turnaround.
- Breakout Confirmation: The confirmation of the pattern occurs when the price passes out of the upper limit of the flag and within a higher volume.
- Trend Continuation Signal: The trend indicates that the past upward movement is expected to persist.
Example:
When a stock goes up 100 to 130 (flagpole), then consolidates 125-128 several sessions (flag), and then breaks out above 130 at high volume. It is a bullish continuation, and thus there is a possibility of a further increase.
Note: Refer this Image as we need to create image like this.
How to Use Bull Flag Candlestick Pattern in Trading?
Investors can use the bullish flag chart pattern in the following ways:
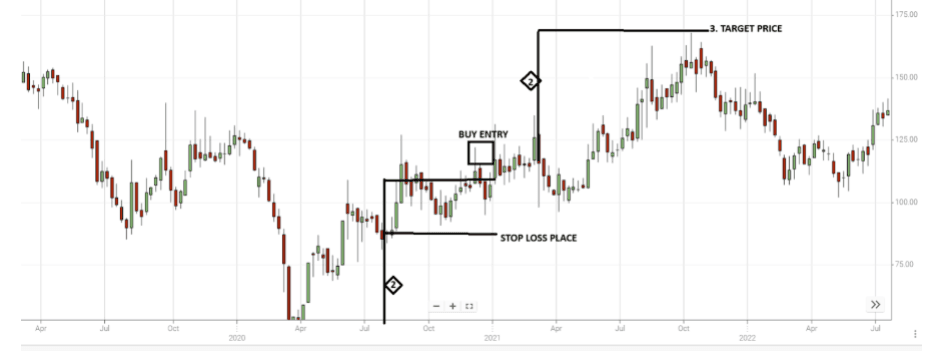
- Entry Point: They can enter a trade when the price breaks above the upper trendline of the flag. They can even make a purchase when at the closing price of the breakout candle.
- Volume Confirmation: Ensure the breakout is supported by higher trading volume for reliability.
- Stop-Loss Placement: Place a stop-loss just below the lower boundary of the flag to manage risk. If a price moves within this range, then it means the pattern might be invalid.
- Target Price: Estimate the target by adding the height of the flagpole to the breakout point.
- Avoid False Breakouts: Wait for a confirmed breakout (closing price above resistance) rather than acting on intraday spikes.
- Use Indicators: Combine with indicators like the relative strength index (RSI) or moving averages for better confirmation. This provides better accuracy and also helps in improving trade reliability.
- Risk Management: Always follow proper position sizing and risk-reward ratio before entering a trade.
Benefits and Limitations of Bull Flag Pattern
The table below shows the benefits and limitations of the bull flag pattern.
Metric | Benefits | Limitations |
| Trend Continuation | Indicates continuation of an existing uptrend. | May fail if the trend loses momentum. |
| Ease of Identification | Easy to spot due to clear flagpole and flag structure. | Can be confused with other consolidation patterns. |
| Entry Opportunity | Provides a clear breakout-based buying opportunity. | False breakouts can lead to losses. |
| Risk Management | Allows defined stop-loss below the flag. | Improper stop placement may increase risk. |
| Reliability | Works well in strong trending markets. | Less reliable in sideways or volatile markets. |
| Volume Confirmation | Volume helps confirm breakout strength. | Volume signals may not always be consistent. |
| Target Calculation | Simple method using flagpole height for target. | Price may not always reach the expected target. |
Conclusion
Bull flag pattern is a continuation pattern, which is an indication of a temporary pause in the current uptrend under which the price moves back to the upward trend. It takes a sharp first upsurge with a brief holding stage, which shows that the entire bullish mood is not lost in the slight disturbances. Investors can see potential buying opportunities more clearly by knowing its structure, breakout confirmation and it's trading strategy. With the help of an online trading app, investors can track such patterns, analyse charts, and execute trades efficiently in real time. Nevertheless, false breakouts may take place, which is why volume analysis and technical indicators should be used to confirm the occurrence.
- BlinkX launches ItsATraderThing Campaign
- blinkX Introduces 'Options Watchlist' to Empower Traders with Real-Time Insights
- BlinkX Enhances Trading with 24/7 Customer Support Capabilities
- Unlocking Seamless Trading: Introducing “Order Slicing” For The FnO Market
- A Game-Changer for Traders: Introducing Horizontal Watchlists
FAQs on Bull Flag Pattern
Can a Bear Flag Turn Bullish?
Yes, in rare cases a bear flag can turn bullish if the price breaks above the upper resistance instead of continuing downward. However, this is considered a pattern failure and should be confirmed with strong volume before taking a trade.
What is the bull flag pattern win rate?
The win rate of a bull flag pattern generally ranges between 60% to 70% when traded with proper confirmation and in a strong uptrend. However, it may vary depending on market conditions and timeframe.
Can a bull flag pattern be a false signal?
Yes, the bull flag pattern can give false signals, especially if the breakout is not supported by strong volume or occurs in a weak trend. This is why confirmation is important.
How reliable is the bull flag pattern?
The bull flag pattern is considered relatively reliable in trending markets, particularly when combined with volume analysis and technical indicators. Its reliability decreases in sideways or volatile markets.
What happens after a bull flag pattern?
After a bull flag pattern, the price usually continues its upward trend following a breakout. The expected move is often similar to the height of the flagpole, although actual movement may vary based on market conditions.