What Is Symmetrical Triangle Pattern?
- ▶<span lang="EN-US" dir="ltr"><strong>How to Identify a Symmetrical Triangle Pattern</strong></span><strong> </strong>
- ▶<span lang="EN-US" dir="ltr"><strong>How to Use Symmetrical Triangle Pattern in Trading?</strong></span><strong> </strong>
- ▶<span lang="EN-US" dir="ltr"><strong>Characteristics of Symmetrical Triangle Pattern</strong></span><strong> </strong>
- ▶<span lang="EN-US" dir="ltr"><strong>Limitation and Benefits of Symmetrical Triangle Pattern</strong></span><strong> </strong>
- ▶<span lang="EN-US" dir="ltr"><strong>Conclusion</strong></span><strong> </strong>
A symmetrical triangle pattern is a chart structure in which the price moves along two converging trendlines. The lower line slopes upward, whereas the top line slopes downward. This symmetrical triangular pattern demonstrates consolidation before a breakout. Traders monitor this structure to anticipate probable price movements. When buyers and sellers are equally powerful, this pattern actually represents market uncertainty. Traders anticipate a significant move in either direction once the price breaks out of the pattern.
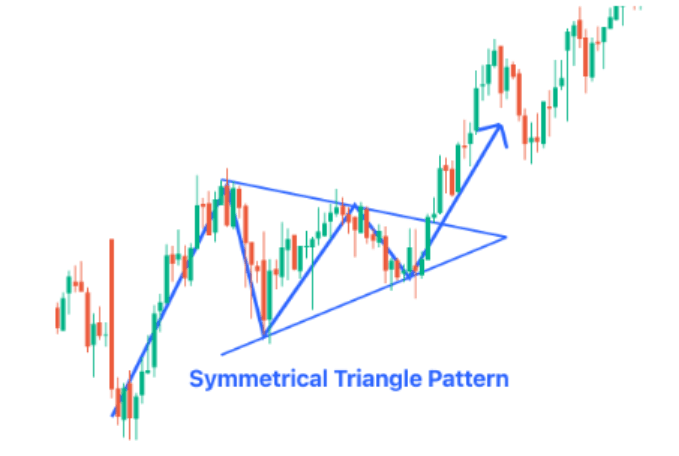
Note: Refer this Image as we need to create image like this.
How to Identify a Symmetrical Triangle Pattern
When prices compress over time, a symmetrical triangular pattern appears, making it simpler to observe charts with clear trendlines.
- Converging Trendlines: Create a triangle by joining lower highs and higher lows. The symmetrical triangular pattern on the chart is defined by this structure.
- Check Price Contraction: As the pattern develops, the price moves inside a narrowing range, indicating decreased volatility in the symmetrical triangle chart pattern.
- Look for Different Touchpoints: A legitimate symmetrical triangular pattern is confirmed by at least two taps on both trendlines.
- Observe Volume Behaviour: As the pattern develops, volume frequently decreases, suggesting less market activity before to a breakthrough.
- Watch for Breakout Direction: Price normally breaks out before reaching the end of the triangle, indicating the next move.
Example:
A stock moves between lower highs and higher lows over several sessions. The trader draws trendlines and sees a clear symmetrical triangle pattern. When price breaks above the upper trendline with volume, the trader considers a buy position.
Note: Refer this Image as we need to create image like this.
How to Use Symmetrical Triangle Pattern in Trading?
The symmetrical triangle pattern is used by traders to schedule their entries and exits in response to breakout signals.
- Early Pattern Identification: When multiple trendlines emerge on the chart, traders notice the symmetrical triangular pattern.
- Wait for Breakout Confirmation: Entry occurs only when the price breaks above or below the pattern with significant movement.
- Use Volume as Support: Increased volume during a breakout gives trades based on the symmetrical triangle chart pattern for more assurance.
- Establish Stop-Loss Levels: To control risk, traders set stop-losses close to the opposing trendline.
- Estimate Target Price: The symmetrical triangular pattern height helps in determining the possible post-breakout price trend.
Characteristics of Symmetrical Triangle Pattern
Traders can immediately identify the symmetrical triangle pattern on charts due to its distinctive qualities.
- Converging Trendlines: The price fluctuates between two lines that get closer with time.
- Higher Lows and Lower Highs: This pattern develops when prices gradually tighten.
- Neutral Nature: Before a breakout, the symmetrical triangle pattern does not prefer a bullish or bearish trend.
- Breakout Dependent Move: Only once the price breaks out of the pattern does the direction become clear.
- Volume Contraction: As the pattern emerges, trading activity declines.
Limitation and Benefits of Symmetrical Triangle Pattern
The symmetrical triangle pattern helps traders in trade planning, but it has significant practical limitations in real-world market situations.
Metric | Benefits of Symmetrical Triangle Pattern | Limitations of Symmetrical Triangle Pattern |
| Signal clarity | Symmetrical triangle pattern gives clear breakout levels. | Breakouts may fail in low momentum markets. |
| Timeframe usage | It works across short and long timeframes. | Short timeframes can give more false signals. |
| Entry and exit | Helps define entry and exit points easily. | Late entries reduce profit potential. |
| Risk management | Supports stop-loss placement using trendlines. | Tight stops may get triggered early. |
| Market behaviour | Reflects price consolidation clearly. | Sudden news can distort the pattern. |
Conclusion
The symmetrical triangle pattern helps traders in projecting breakouts and understanding price consolidation. It shows how markets shift when buying and selling pressure remains balanced for a while. This pattern is used by traders to create goals, control risk, and schedule entry. Even though the symmetrical triangle pattern provides a clear framework, trades still require confirmation. Traders can use indicators, watch trends, and execute trades with more timing and control by using tools like an online trading app.
- BlinkX launches ItsATraderThing Campaign
- blinkX Introduces 'Options Watchlist' to Empower Traders with Real-Time Insights
- BlinkX Enhances Trading with 24/7 Customer Support Capabilities
- Unlocking Seamless Trading: Introducing “Order Slicing” For The FnO Market
- A Game-Changer for Traders: Introducing Horizontal Watchlists
FAQs on Symmetrical Triangle Pattern
Is the Symmetrical Triangle bullish or bearish in nature?
The symmetrical triangle pattern is neutral. The breakout determines the direction, which might be either upward or downward.
How can I trade the Symmetrical Triangle pattern?
Traders wait for a proven breakout from the symmetrical triangle pattern before entering trades based on direction, supported by volume and appropriate risk management.
Can a Symmetrical Triangle be bearish in nature?
Yes, the symmetrical triangle pattern can turn bearish if price breaks below the lower trendline with strong momentum.
What is the target price of the symmetrical triangle chart?
The target price is often established by measuring the pattern's height and projecting it from the breakout point of the symmetrical triangular pattern.