India’s core sector growth slowed to 0.1 per cent in October
October 2022 – Leading and Lagging Core Sectors
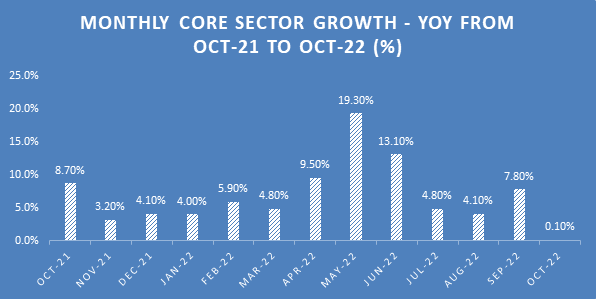
The Core sector growth or Infrastructure growth announced each month with a 1-month lag, is a critical input that goes into the IIP and the GDP. The core sector accounts for 40.27% of the IIP basket and hence is an important leading indicator for IIP growth and for GDP growth. After a robust 7.8% core sector growth in September 2022, the core sector growth has dipped to just 0.1% in October 2022. In a sense, the high base of 8.7% in October 2021 also played a part in depressing the core sector growth for the latest month. But as the base tapers, this should improve in the coming months.
A good barometer of how future data will pan out is the revisions to previous core sector numbers. The first revision in core sector growth for September 2022 has seen a minor negative revision by 10 basis points from 7.90% to 7.80%. However, the final revision for July 2022 resulted in an upgrade by 30 bps from 4.50% to 4.80%. with the government directing a lot of its efforts into capex spending, this should improve in coming months.
Data Source: DPIIT (Department for Promotion of Industry and Internal Trade)
The core sector is a quick analysis of how the 8 most important infrastructure sectors performed last month in terms of output growth. These eight sectors include coal sector, electricity, crude oil, refined products, natural gas, steel, cement and fertilizers. For October 2022, 4 core sectors showed positive growth and 4 showed negative growth.
Table of Contents
October 2022 – Leading and lagging core sectors
In October 2022, only 4 out of 8 core sectors were in the green. Let us start with the sectors that showed positive traction in the month. Broadly, the volatility in oil prices and delay in the pricing policy led to weak growth in the hydrocarbon segment. For instance, crude oil saw -2.2% contraction, refinery products -3.1% contraction and natural gas -4.2% contraction in output for October 2022. Cement was another segment that struggled with -4.3% fall in output in the month amidst weak demand conditions.
Let us move on to the core sectors that showed positive traction in the month of October 2022. Thanks to Coal India getting aggressive on production and enhanced output from captive coal mines, the coal output for the month was up by 3.6%. Higher subsidy support and a fall in price of inputs led to a 5.4% growth in fertilizers output for the month of October 2022. With export curbs going away, steel output bounced back sharply showing 4% growth in the month. With more assured coal supplies, the electricity output for the month of October 2022 showed a marginal growth of 0.4% for the month. Overall, it was an extremely mixed performance by the core sectors.
High frequency core sector flattens in October 2022
The high frequency core sector growth (unlike the normal yoy growth) is calculated on a month-on-month basis. This is largely a very good short term measure that captures the direction of the momentum. For the last 4 months from June to September, the high frequency core sector growth had been negative. The positive trend is that the momentum has flattened out in the month of October 2022.
| Core Sector Component | Weight | Oct-22 (YOY) % | Oct-22 (MOM) % | FY23 Cumulative (%) * |
| Coal | 10.3335 | +3.6% | +14.1% | +18.1% |
| Crude Oil | 8.9833 | -2.2% | +2.9% | -1.4% |
| Natural Gas | 6.8768 | -4.2% | +1.2% | +0.9% |
| Refinery Products | 28.0376 | -3.1% | +2.7% | +8.1% |
| Fertilizers | 2.6276 | +5.4% | +2.0% | +10.5% |
| Steel | 17.9166 | +4.0% | +2.8% | +6.1% |
| Cement | 5.3720 | -4.3% | -2.4% | +8.6% |
| Electricity | 19.8530 | +0.4% | -10.4% | +9.3% |
| Core Sector Growth | 100.0000 | +0.1% | 0.00% | +8.2% |
Data Source: DPIIT (* FY23 is Apr-Oct)
The critical data point to watch out is the fourth column of MOM growth (shaded column), which represents high frequency growth for October over September. While the YOY figure is influenced by the base effect, the high frequency MOM growth captures short term headwinds lot better. After 4 months of negative MOM core sector contraction, the high frequency core sector has turned flat in October, which is a good indication.
Here are some of the key takeaways.
- The first data column is the weightage column showing the impact that a change in a particular component can have on the overall core sector growth. Refinery products, electricity, Coal and steel have a combined weight of over 75%.
- The second column is the break-up of yoy core sector growth of 0.1% for October 2022. Here, only 4 out of 8 core sectors are in the positive, with hydrocarbons and cement contracting on a yoy basis. Positive thrust came from coal mining, steel and fertilizers.
- The all-important MOM column captures high-frequency momentum of the infrastructure. Here, only cement and electricity are showing short term negative momentum while the rest of the sectors are showing positive momentum. The good news is that the MOM core sector has turned flat after 4 negative months.
A 10-year perspective of core sector growth
Here is a time-series evaluation of the core sector growth over last 10 years.
| Year | 2012-13 | 2013-14 | 2014-15 | 2015-16 |
| Core Sector Growth (%) | 3.8% | 2.6% | 4.9% | 3.0% |
| Year | 2016-17 | 2017-18 | strong>2018-19 | 2019-20 |
| Core Sector Growth (%) | 4.8% | 4.3% | 4.4% | 0.4% |
| Year | 2020-21 | 2021-22 | 2022-23 (7 mths) | |
| Core Sector Growth (%) | -6.4% | 10.4% | 8.2% |
Data Source: DPIIT
As of the close of October 2022, there is 7-months data for FY23, which should give a reliable picture. For FY22, full year core sector growth was 10.4%, but that was on a very low base and hence not sustainable. The 8.2% annualized core sector growth in FY23 is on a more normalized base. However, FY23 has some serious headwinds in terms of central bank hawkishness, high levels of inflation, recession fears, fall in consumption and supply chain constraints. All these factors are hitting core sector output and hopefully, things will improve as the government and the private sector trigger investments. For now, the best case scenario for FY23 would be if this level can be sustained for the remaining five months.