Bollinger Bands Indicator
- ▶<span lang="EN-US" dir="ltr"><strong>How This Indicator Works</strong></span><strong> </strong>
- ▶<span lang="EN-US" dir="ltr"><strong>Bollinger Bands Formula & Calculation</strong></span><strong> </strong>
- ▶<span lang="EN-US" dir="ltr"><strong>Trading Strategies Using Bollinger Bands</strong></span><strong> </strong>
- ▶<span lang="EN-US" dir="ltr"><strong>Types of Bollinger Bands Indicator</strong></span><strong> </strong>
- ▶<span lang="EN-US" dir="ltr"><strong>Limitations of Bollinger Bands</strong></span><strong> </strong>
- ▶<span lang="EN-US" dir="ltr"><strong>Conclusion</strong></span><strong> </strong>
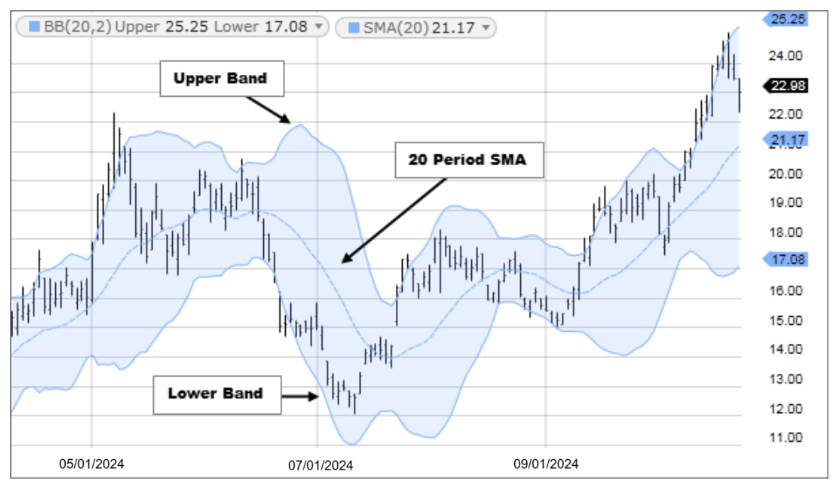
The Bollinger Bands indicator is a technical analysis tool that measures price volatility in financial markets. It is made up of three lines on a price chart. A center moving average and two outer bands set above and below. The Bollinger Bands indicator is used by traders to analyse market movement and spot potential overbought or oversold situations. To help traders understand possible price trends and reversals, the distance between the bands varies based on market volatility.
Note: Refer this Image as we need to create image like this.
How This Indicator Works
The Bollinger Bands indicator analyses price volatility and how it relates to the moving average.
- Moving Average in the Middle Band: The average price over a given time period is shown by the center line, which is a simple moving average.
- Bands at the Top and Bottom: Based on price volatility, two outside bands are shown above and below the moving average.
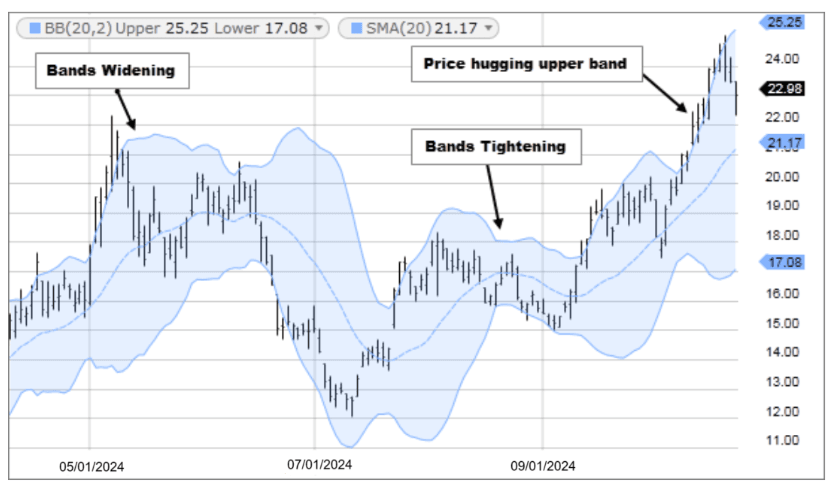
- Measurement of Volatility: The gap between the bands grows as market volatility rises.
- Periods with Low Volatility: The bands get closer together as volatility declines.
- Price-Band Interaction: To determine potential market conditions, traders watch how prices move close to the upper or lower bands.
Note: Refer this Image as we need to create image like this.
Bollinger Bands Formula & Calculation
Bollinger Bands are calculated using the standard deviation and moving average. These elements help in calculating how far prices move from the mean.
Formula:
- Middle Band = Simple Moving Average (SMA)
- Upper Band = SMA + (Standard Deviation × 2)
- Lower Band = SMA − (Standard Deviation × 2)
Calculation Process
First, the asset’s price simple moving average is calculated over a predetermined time frame, often 20 trading sessions. Next, during the same period, the price movement standard deviation is computed. The standard deviation is then added to and subtracted from the moving average to form the upper and lower bands.
Trading Strategies Using Bollinger Bands
When examining the Bollinger Bands indicator, traders use a number of techniques to interpret market movements.
- Band Bounce Technique: Prices frequently fluctuate between the top and bottom bands. Traders look for price movements that approach the outer bands before returning to the middle band.
- Bollinger Squeeze Technique: A period of low volatility may be indicated when the bands get closer to one another. This pattern is observed by traders because it occasionally precedes more significant price action.
- Strategy for Breakout: Traders may see a possible breakout when prices move far outside of the upper or lower band.
- Trend-Following Approach: Prices may continue to move along the upper or lower band during strong trends. To determine the strength of a trend, traders frequently examine this behaviour.
Types of Bollinger Bands Indicator
Depending on trading preferences, the Bollinger Bands indicator can be used for a variety of ways.
- Typical Bollinger Bands: With two standard deviation bands and a basic moving average, this is the most popular type.
- Bollinger Bands with Modifications: To fit trading techniques, some traders modify the standard deviation level or moving average period.
- Several Bollinger Bands: In certain techniques, traders assess various degrees of volatility using multiple sets of bands.
Limitations of Bollinger Bands
After understanding what is Bollinger bands indicator and how it is calculated, here are several drawbacks.
- Lagging Nature: Signals may emerge after the price movement has begun because the indicator is based on past price data.
- False Indications: It is possible for prices to move outside of the bands without verifying a significant trend, which could result in false signals.
- Dependency on Volatility: The indicator does not directly show the direction of the trend; instead, it mostly monitors volatility.
- Needs More Indicators: Bollinger Bands are frequently used alongside other indicators by traders to validate their trading choices.
Conclusion
The Bollinger bands indicator is a popular technical tool used by traders to assess market volatility and price behaviour. It offers insights into potential price changes and market circumstances by utilising a moving average and volatility band. To make better decisions, traders frequently combine this indicator with additional analysis techniques. Investors who review such indicators regularly may find it easier to assess market movements. Using an online trading app can help them monitor price charts and trading opportunities more efficiently.
- BlinkX launches ItsATraderThing Campaign
- blinkX Introduces 'Options Watchlist' to Empower Traders with Real-Time Insights
- BlinkX Enhances Trading with 24/7 Customer Support Capabilities
- Unlocking Seamless Trading: Introducing “Order Slicing” For The FnO Market
- A Game-Changer for Traders: Introducing Horizontal Watchlists
FAQs on Bollinger Bands Indicator
Which indicator is best for Bollinger Bands?
Bollinger bands combined with volume indicators like the On-balance volume (OBV) is useful to measure the strength of price movements. Higher trading volume near the upper or lower bands can indicate possible reversals.
What do Bollinger Bands tell you?
Using Bollinger Bands, you can identify any sharp, short-term price movements and potential entry and exit points.
How do you read Bollinger Bands strategy?
When the price hits the upper Bollinger band, it could indicate overbought conditions and suggest a potential price correction. On the contrary, if the price touches the lower Bollinger band, it may indicate oversold conditions, suggesting at a possible price rebound.
How can I improve my Bollinger Band?
To improve Bollinger Bands, it can be combined with other technical indicators. A few of the complementary indicators include the Stochastic Oscillator, Moving Average Convergence Divergence (MACD), and Relative Strength Index (RSI).
How do you use the Bollinger Band indicator?
The "bollinger bands" indicator is used by investors to identify price volatility and possible entry/exit points. This is observed by traders when the price touches the upper or lower bands, allowing them to understand the overbought/oversold levels of the stock.