What is a Red Hammer Candlestick?
- ▶What is the Red Hammer Candlestick Pattern?
- ▶Red Hammer <a href="https://blinkx.in/en/knowledge-base/candlestick-patterns/how-to-read-candlestick-charts"><u>Candlestick </u></a>Formation
- ▶What Does Red Hammer Candlestick Indicate?
- ▶How to Identify the Red Hammer Pattern?
- ▶How to Trade Using Red Hammer?
- ▶Red Hammer vs Other Hammer Patterns
- ▶Advantages of Red Hammer Pattern
- ▶Limitations of Red Hammer
The red hammer candlestick pattern is a powerful bullish reversal signal that forms at the bottom of a downtrend, alerting traders to a potential shift in market momentum. This comprehensive guide breaks down the red hammer candlestick's meaning and offers a practical blueprint for effectively trading it for maximum profitability.
What is the Red Hammer Candlestick Pattern?
The red hammer candlestick pattern is a single-bar chart formation characterized by a small bearish body at the top and a long lower shadow.
- Bullish Reversal: Despite closing lower than it opened, it signifies that buyers aggressively pushed the price back up from its session lows.
- Downtrend Context: It is only technically relevant when it follows a sustained decline in asset prices.
- Market Psychology: It reveals that sellers are losing control of the market as demand begins to overwhelm supply.
- Volume Validation: The reliability of this pattern increases significantly if it forms on higher-than-average trading volume.
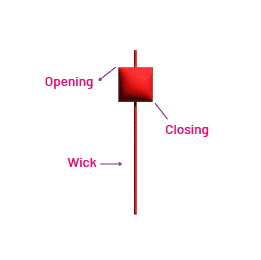
Red Hammer Candlestick Formation
Understanding how the red hammer candlestick pattern is constructed helps traders visualize the intraday battle between bulls and bears.
- Small Bearish Body: The closing price finishes slightly below the opening price, which colors the real body red (or black).
- Long Lower Wick: The lower shadow must be at least two to three times the total height of the candlestick's real body.
- Minimal Upper Wick: There is little to no upper shadow, indicating that the price closed very close to the high of the session.
- Session Dynamics: The asset opened, plummeted heavily due to selling pressure, but recovered almost entirely by the closing bell.
What Does Red Hammer Candlestick Indicate?
Deciphering the red hammer candlestick meaning provides crucial clues regarding immediate shifts in institutional order flow.
- Rejection of Lows: The long tail indicates a strong rejection of lower price levels by major market participants.
- Seller Exhaustion: It shows that the prevailing bearish momentum has run out of steam, and a bottom may be forming.
- Imminent Pivot: It suggests that market sentiment is transitioning from fear and panic selling to active accumulation.
- Support Confirmation: It often indicates that the stock has hit a major structural support level or moving average.
How to Identify the Red Hammer Pattern?
Spotting genuine hammer candlestick patterns in stock market environments requires filtering out weak or false price actions.
- Location Matters: Look for the pattern strictly at the end of a clear, consecutive series of downward-moving candles.
- Body-to-Wick Ratio: Measure the lower tail to ensure it is disproportionately longer than the squarish upper red body.
- Top-Heavy Structure: The real body must sit entirely at the upper end of the daily trading range.
- No Long Upper Tail: If there is a noticeable upper wick, it disqualifies the structure from being a true hammer.
How to Trade Using Red Hammer?
Learning how to trade hammer candlestick setups properly requires strict entry rules, stop-loss placements, and confirmation signals.
- Wait for Confirmation: Enter a long position only after the next candle breaks and closes above the high of the red hammer.
- Stop-Loss Placement: Place your protective stop-loss order just below the lowest point of the hammer’s long lower wick.
- Profit Targets: Target the next major horizontal resistance zone or use a minimum risk-to-reward ratio of 1:2
- Incorporate Indicators: Combine the setup with oversold readings on the RSI or MACD to increase your overall win rate.
Red Hammer vs Other Hammer Patterns
Comparing different hammer candlestick patterns in stock market trading helps clarify the subtle differences in their visual structures.
- Green Hammer Comparison: A green hammer closes higher than it opens, making it inherently slightly more bullish than its red counterpart.
- Inverted Hammer Difference: The inverted hammer has its long wick extending upward, signaling a completely different type of market pressure.
- Hanging Man Contrast: While identical in shape to a red hammer, a Hanging Man forms at the peak of an uptrend and is a bearish signal.
- Trading Execution: Despite the slight color difference, the execution rules on how to trade hammer candlestick formations remain virtually identical for both red and green variations.
Advantages of Red Hammer Pattern
Incorporating this specific candlestick into your technical analysis routine offers several clear strategic benefits.
- Early Trend Catching: It allows traders to enter a new bullish trend right at its absolute inception point.
- Defined Risk Parameters: Because the low of the wick serves as a structural floor, setting invalidation points is incredibly straightforward.
- High Reward Potential: Catching a reversal early offers an asymmetrical risk profile with large upside targets.
- Universal Application: The pattern works effectively across multiple timeframes, from 5-minute intraday charts to weekly macro charts.
Limitations of Red Hammer
Even with a strong grasp of the red hammer candlestick meaning, traders must remain aware of its inherent blind spots.
- False Breakouts: The pattern can occasionally fail, trapping buyers if the underlying downtrend decides to resume fiercely.
- No Price Targets: The candlestick structure itself does not provide an inherent formula for calculating where the rally will stop.
- Requires Context: It can produce highly unreliable and choppy signals if it forms during a sideways, consolidating market.
- Lagging Nature: Waiting for the necessary next-candle confirmation can sometimes cause you to miss a portion of the initial upward move.
Conclusion
Red hammer candlestick is an essential pattern for investors and traders in the stock market. It indicates potential reversal points and helps make informed trading decisions. They are often observed at the bottom of downtrends and signify bullish reversal sentiments.
- BlinkX launches ItsATraderThing Campaign
- blinkX Introduces 'Options Watchlist' to Empower Traders with Real-Time Insights
- BlinkX Enhances Trading with 24/7 Customer Support Capabilities
- Unlocking Seamless Trading: Introducing “Order Slicing” For The FnO Market
- A Game-Changer for Traders: Introducing Horizontal Watchlists
FAQs on Red Hammer Candlestick
Are Red Candlesticks always bearish?
Red candlesticks, while typically representing periods with lower closing prices than opening prices, do not necessarily signify a bearish sentiment. The understanding of these colours depends on the context of price action and market conditions.
Can Red Candlesticks be used in isolation for trading decisions?
Red candlesticks offer valuable market insights, but their use alone may lead to inaccurate analysis. Traders should consider other factors like trading volume, market conditions, and technical indicators to validate their analysis and improve trading performance.
Are there any other commonly used candlestick colours?
Common candlestick colours include green or white, black, and blue. They represent bullish price movements, bearish price movements, and neutral price movements. These colours aid traders in visualising price action and market sentiment, aiding in technical analysis and decision-making processes.
What role should Red Hammer Candlestick Patterns play in a trader's approach?
Red Hammer Candlestick Patterns can be integrated into traders' trading strategies for market trend analysis and decision-making, requiring a combination of these patterns with other technical analysis tools for a thorough evaluation.
IIs a Red Hammer Candlestick Pattern a dependable indicator at all times?
The Red Hammer Candlestick Pattern offers valuable bullish reversal insights, but it's not a reliable signal alone. Traders should consider factors like trading volume, market conditions, and technical indicators before making decisions.