What is Exponential Moving Average (EMA)
- ▶<span lang="EN-US" dir="ltr"><strong>How does an Exponential Moving Average Work?</strong></span><strong> </strong>
- ▶<span lang="EN-US" dir="ltr"><strong>How to Calculate EMA in Stock Market?</strong></span><strong> </strong>
- ▶<span lang="EN-US" dir="ltr"><strong>EMA Formula</strong></span><strong> </strong>
- ▶<span lang="EN-US" dir="ltr"><strong>Example of EMA Calculation</strong></span><strong> </strong>
- ▶<span lang="EN-US" dir="ltr"><strong>Significance of the EMA in Stock Trading</strong></span><strong> </strong>
- ▶<span lang="EN-US" dir="ltr"><strong>Benefits & Limitations of Exponential Moving Average</strong></span><strong> </strong>
- ▶<span lang="EN-US" dir="ltr"><strong>Conclusion</strong></span><strong> </strong>
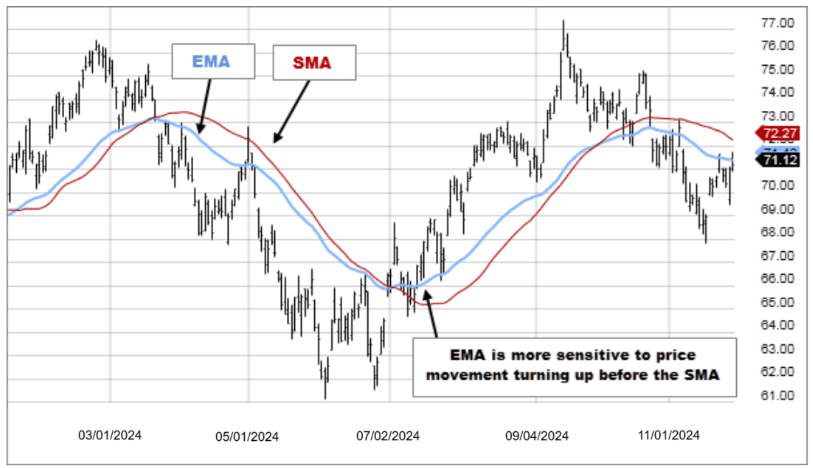
Exponential Moving Average (EMA) is a technical indicator used in stock market analysis that gives more weight to recent price data while calculating the average price of a security over a selected period. This weighting makes EMA react faster to price movements than a simple moving average. Traders track EMA to observe price trends, possible reversals, and market momentum. It is often plotted directly on price charts and used with different time periods. In many cases, it supports short-term decision-making during market analysis. Basically, EMA helps traders understand price direction more clearly. This article explains how EMA works, how to calculate it, its importance, and more.
Note: Refer this Image as we need to create image like this.
How does an Exponential Moving Average Work?
The EMA full form in stock market is Exponential Moving Average. The following points explain how an Exponential Moving Average generally functions in stock chart analysis.
- EMA tracks the average price of a stock over a chosen period while assigning higher weight to the latest prices.
- Recent price movements influence the indicator more than older data points.
- The line moves along with the stock chart and adjusts whenever the price changes.
- Short-term EMAs respond faster to market movement than long-term EMAs.
- Traders compare multiple EMAs to observe trend direction or possible trend shifts.
Example:
If a trader uses a 10-day EMA, the indicator calculates the average price for the last ten days but assigns higher importance to the latest day’s closing price. If the stock price rises quickly, the EMA line also moves upward faster than a simple moving average.
Note: Refer this Image as we need to create image like this.
How to Calculate EMA in Stock Market?
The following points explain the basic steps used to calculate the Exponential Moving Average (EMA) in the stock market.
Steps to calculate EMA
- Start with Simple Moving Average (SMA):
The first EMA value usually begins with the SMA. This is calculated by adding the closing prices of a stock for a selected period and dividing the total by the number of days. - Calculate the Multiplier:
The multiplier decides how much weight is given to the latest price. It helps the EMA react faster to recent market changes. The formula used for computing the multiplier is [2/ (total number of observations + 1)] - Apply the EMA formula:
After finding the multiplier and the previous EMA value, the formula is used to calculate the current EMA for the latest trading day.
EMA Formula
- EMA = [Closing Price of the Stock x the Multiplier] + [Previous Day EMA x (1- the Multiplier)]
Components of the formula
- Closing Price: The latest closing price of the stock.
- Multiplier: A value used to give higher weight to recent prices.
- Previous EMA: The EMA value calculated for the previous trading period.
- (1 − Multiplier): The remaining weight given to earlier price data.
Example of EMA Calculation
Assume a trader wants to calculate a 10-day EMA.
Step 1: Find the multiplier
- Multiplier = 2 ÷ (10 + 1)
- Multiplier ≈ 0.1818
Step 2: Use the formula
Assume:
- Closing Price = 105
- Previous EMA = 100
- Multiplier = 0.1818
- EMA = (105 × 0.1818) + (100 × 0.8182)
- EMA ≈ 100.91
This calculated value becomes the updated EMA and is then used for the next trading day’s calculation.
Note: Refer this Image as we need to create image like this.
Significance of the EMA in Stock Trading
The following points describe the role of EMA while analysing stock market trends.
- Trend Identification: EMA moving upward may reflect a rising price trend, while a downward slope may indicate a falling trend.
- Entry and Exit Observation: Traders monitor price movement around the EMA line to study possible entry or exit points.
- Crossover Analysis: When a short-term EMA crosses above a long-term EMA, it may indicate rising momentum; the opposite crossover may indicate weakening momentum.
- Short-term Market Tracking: EMA reacts faster to recent price changes, which can be helpful in short-term analysis.
- Chart Interpretation Support: It is often used alongside indicators such as RSI or MACD while analysing price charts.
Benefits & Limitations of Exponential Moving Average
The table below outlines some commonly observed benefits and limitations of the EMA indicator.
Benefits of Exponential Moving Average | Limitations of Exponential Moving Average |
| Responds faster to recent price movements compared to simple moving averages | Can react strongly to short-term price fluctuations |
| Highlights short-term trends clearly on price charts | May give misleading signals during sideways markets |
| Used for crossover analysis in trading strategies | Depends on the selected time period |
| Works well with other technical indicators | Does not predict price direction on its own |
| Helps in tracking market momentum visually | Requires interpretation along with other market factors |
Conclusion
The Exponential Moving Average is widely used in technical analysis to observe price trends and momentum in stock charts. Since it assigns greater weight to recent prices, the indicator reacts faster to market movement than some other averages. Traders often review EMA values while analysing price charts on an online trading app or trading platform. However, it is typically studied along with other indicators and market factors. Understanding how EMA works and how it is calculated can support better chart interpretation and trading analysis.
- BlinkX launches ItsATraderThing Campaign
- blinkX Introduces 'Options Watchlist' to Empower Traders with Real-Time Insights
- BlinkX Enhances Trading with 24/7 Customer Support Capabilities
- Unlocking Seamless Trading: Introducing “Order Slicing” For The FnO Market
- A Game-Changer for Traders: Introducing Horizontal Watchlists
FAQs on Exponential Moving Average
Explain what is EMA in stocks?
EMA (Exponential Moving Average) in stocks is a technical analysis indicator that assigns more weight to recent price data, providing a smoothed representation of the stock's trend.
How often should EMA be recalculated?
EMA should be recalculated for each new data point. Traders often use daily, weekly or intraday data, depending on their trading style.
What is the difference between EMA and SMA?
The main difference between EMA and SMA lies in the way they assign weight to data points.
What is the significance of EMA in stock trading?
EMA holds significant importance in stock trading. It helps identify trends, smoothes price data, acts as support and resistance levels, generates entry and exit signals, and tracks momentum.
Can EMA be used as the sole indicator for trading decisions?
While EMA is a valuable tool in stock trading, it is recommended to use it in combination with other indicators and analysis methods.