Bullish Candlestick Patterns Meaning
- ▶What are Bullish Candlestick Patterns?
- ▶Types of Bullish Candlestick Patterns
- ▶Risk Management with a Bullish Candlestick Pattern
- ▶How to Validate Bullish Candlestick Patterns with Other Indicators?
- ▶Things to Know Before Trading Candlestick Patterns
- ▶How to Identify a Bullish Pattern
Candlesticks are crucial in quantitative trading, representing price movements in financial instruments like securities, derivatives, and currencies. They summarize Open, High, Low, and Close prices over a specific time frame. Candlestick patterns, including bullish and bearish variations, can be learned and integrated into trading strategies. Bullish candlestick patterns in stock market, resembling real-life candlesticks, offer valuable insights into market trends and price action, enabling traders to make informed decisions.
What are Bullish Candlestick Patterns?
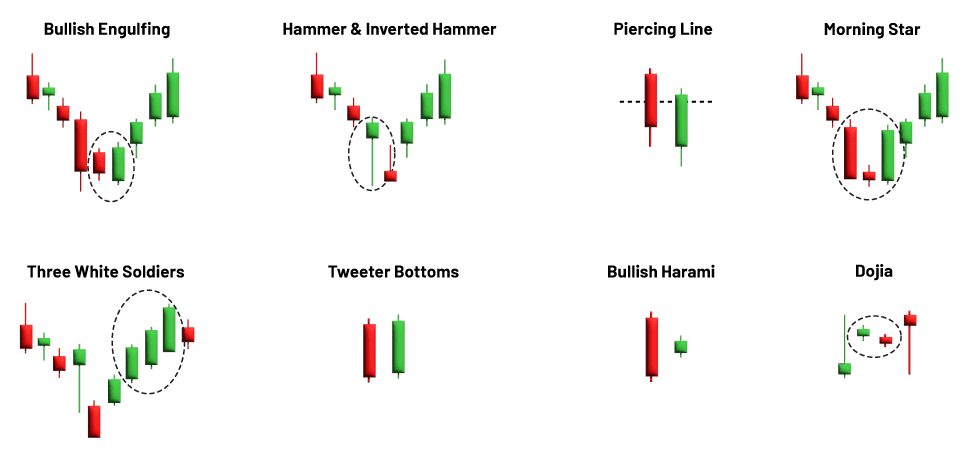
Bullish candlestick patterns in stock market are a type of financial market trend that indicate a potential upward price movement. These patterns are observed in candlestick charts, which display the open, high, low, and close prices of a security within a specific time frame. They often indicate buying pressure and optimism among traders. Common bullish candlestick patterns in stock market include the "bullish engulfing pattern," where a large bullish candlestick completely engulfs the preceding bearish candlestick, signalling a shift in market sentiment from bearish to bullish. The "hammer" pattern, characterised by a small body and a long lower shadow, suggests sellers pushed prices lower but were ultimately rejected. The "morning star" pattern, consisting of three candles, suggests a potential reversal from a downtrend to an uptrend.
Types of Bullish Candlestick Patterns
Following are the types of bullish candlestick patterns
Risk Management with a Bullish Candlestick Pattern
Now that we know the types of bullish candlestick patterns, let's learn more about the risks of trading using bullish candlestick patterns and how to overcome them:
| Risk | Explanation | Mitigation |
|---|---|---|
| False Signals | Bullish candlestick patterns might result in losses if the market fails to confirm. | Utilise further confirmation from indications or trends. Look for convergence. |
| Market Volatility | High volatility can lead to fast price fluctuations. | Use stop-loss orders to reduce losses. |
| Overfitting & Data Mining Bias | Analysing historical data may yield techniques that do not work in the present time. | Focus on good logic and flexibility rather than relying too heavily on past success. |
| Emotional Trading | Observing candlestick patterns presents emotional hurdles. | Create a disciplined trading strategy. Avoid making rash decisions. |
| Lack of Proper Money Management | Trading without a clearly defined money management plan increases risk. | Determine position sizes depending on risk tolerance. Use the stop-loss and take profit orders. |
| News and Events | Unexpected news may swiftly shift market sentiment. | Stay current with news. Consider precautionary measures during periods of instability. |
| Market Liquidity | Illiquid markets may give unreliable patterns. | Exercise caution while dealing with thinly traded assets. Stick to more liquid markets. |
| Technical Analysis Limitations | Technical analysis has limits. | Combine with fundamental analysis to get a complete picture. |
How to Validate Bullish Candlestick Patterns with Other Indicators?
Validating bullish candlestick patterns with other indicators will improve the dependability of your trading signals while lowering the chance of false signals.
- Trend Confirmation: Check the overall market trend to confirm a bullish pattern within an existing uptrend. Use indicators like trendlines, moving averages, or Moving Average Convergence Divergence (MACD).
- Volume Analysis: To assess volume trends, use indicators like On-Balance Volume (OBV) or Volume-Weighted Average Price (VWAP).
- Momentum Oscillators: Look for oversold readings in the oscillator to support the potential reversal indicated by the candlestick pattern.
- Moving Averages: Compare the price action to different moving averages to confirm the pattern.
- Support and Resistance Levels: Identify key support and resistance levels on the price chart.
- Fibonacci Retracements: Use these levels to identify potential price reversal zones.
- Multiple Timeframes: Analyse the pattern on multiple timeframes for stronger confirmation.
Also Read: What are Reversal Candlestick Patterns?
Things to Know Before Trading Candlestick Patterns
Before trading candlestick patterns, there are several important factors to consider to maximise your chances of success and minimise risks:
- Understanding Market Context: Recognize the broader market conditions, including trends, support and resistance levels, and key economic events that may impact price movements.
- Confirmation Signals: Don't rely solely on candlestick patterns for trading decisions. Look for confirmation from other technical indicators or fundamental analysis to validate the signals provided by candlestick patterns.
- Risk Management: Implement proper risk management strategies, including setting stop-loss orders and calculating position sizes based on your risk tolerance and trading account size.
- Practice and Experience: Before trading with real money, practice identifying and interpreting candlestick patterns on demo accounts or through paper trading to gain experience and refine your skills.
- Consider Timeframes: Candlestick patterns may vary in significance depending on the timeframe you're trading. Be mindful of the timeframe you're analysing and trading within.
- Avoid Overtrading: Don't trade every candlestick pattern you see. Be selective and focus on high-probability setups that align with your trading strategy and market analysis.
- Continuous Learning: Stay updated on market trends, new candlestick patterns, and evolving trading strategies through books, online resources, and trading forums to improve your trading skills over time.
How to Identify a Bullish Pattern
Let’s understand bullish pattern analysis process:
- Step 1: Observe the Chart- Obtain a candlestick or price chart for asset analysis from various charting platforms or financial websites.
- Step 2: Determine the Trend- Identify the present trend in price movement. A bullish pattern is more significant when it emerges within an established uptrend, but it may also indicate a trend of bullish reversal candlestick patterns if it occurs during a drop.
- Step 3: Look for Certain Patterns- Concentrate on single candlestick patterns or groups of candlesticks that suggest a bullish attitude. Common bullish patterns include Hammer, Bullish Engulfing, Piercing Line, Bullish Harami, Morning Star, Bullish Marubozu, Dragonfly Doji, and Bullish Belt Hold, as previously indicated.
- Step 4: Check for Confirmation- Once you've identified a possible bullish pattern, check for confirmation from additional technical indicators or price patterns. Volume analysis, trendlines, moving averages, and other chart patterns can all provide additional proof.
- Step 5: Consider the Timeframe- Analyse the pattern over a selected timeframe that corresponds to your trading approach. Bullish patterns can occur on a variety of timescales, including daily, hourly, and minute charts.
- Step 6: Evaluate the Market Context-Examine the larger market environment, including fundamental considerations and market emotion, to determine the importance of the bullish pattern. Market news and events might have an impact on the trustworthiness of technical patterns.
- Step 7: Practise and Experience-Identifying bullish patterns involves practice and experience. Continuously examine past charts to strengthen your pattern detection abilities.
- Step 8: Risk Management-When trading on bullish patterns, be sure to use adequate risk management measures. Use stop-loss orders to limit possible losses and prevent overcommitting to a single trade.
Conclusion
Finally, candlestick patterns, like other price action tactics, can help you anticipate market movement and increase your trading performance when employed appropriately. But this is not a guarantee, so trade with caution and limit your risk. There are several patterns to pick from. Finally, select a dependable online trading app that can improve decision-making and risk-management methods. Decide which one appeals to you and begin practising immediately!
- BlinkX launches ItsATraderThing Campaign
- blinkX Introduces 'Options Watchlist' to Empower Traders with Real-Time Insights
- BlinkX Enhances Trading with 24/7 Customer Support Capabilities
- Unlocking Seamless Trading: Introducing “Order Slicing” For The FnO Market
- A Game-Changer for Traders: Introducing Horizontal Watchlists
FAQs on Bullish Candlestick Patterns
Which candlestick pattern is bullish?
Various candlestick patterns can indicate bullish sentiment in the market. Some common bullish candlestick patterns include the bullish engulfing pattern, hammer, morning star, and piercing pattern.
What is the most bullish chart pattern?
While several chart patterns signal bullish market sentiment, the "cup and handle" pattern is often considered one of the most bullish. It typically forms during an uptrend and consists of a rounded bottom (the cup) followed by a consolidation period (the handle), suggesting a potential continuation of the uptrend.
How reliable are bullish candlestick patterns?
Bullish candlestick patterns and bullish reversal candlestick patterns can be reliable indicators of potential upward price movement, but they are not foolproof. It's essential to consider other factors such as market context, volume, and confirmation signals from other technical indicators to assess the reliability of bullish candlestick patterns.
Can bullish candlestick patterns appear in any market?
Yes, bullish candlestick patterns can appear in any financial market, including stocks, forex, commodities, and cryptocurrencies. However, the significance of these patterns may vary depending on the liquidity and volatility of the market being analysed.
Should I only rely on bullish candlestick patterns for trading decisions?
While bullish candlestick patterns provide valuable insights into potential buying opportunities, it's essential to consider other technical indicators, fundamental analysis, and market conditions before making trading decisions. Relying solely on candlestick patterns may lead to missed opportunities or increased risk.